
Sensitivity analysis is a method used in financial modeling to examine how various independent variable values impact a certain dependent variable in a given set of circumstances. In other terms, performing sensitivity analysis as an FP&A professional determines how different types of ambiguity in a mathematical model affect the overall level of uncertainty in the model.
This method is used within predetermined bounds that hinge on one or more input variables. Also, sensitivity analysis is one of the best tools for decisions making.
How Does A Sensitivity Analysis Work?
It is sometimes referred to as what-if or simulation analysis, and financial analysts and economists are the most frequent users. Furthermore, you can use it to determine how interest rates impact bond prices and to forecast share values for publicly listed corporations.
Additionally, analysts can identify which factors are more important than others in influencing a choice using this method. As a result, it gives investors perspective on how various factors may affect the prospective returns on their investments. Also, the analyst will observe how the variables change in addition to how the input variable influences the target. Above all, sensitivity analysis enables predicting using previous data, allowing for the making of crucial corporate, economic, and financial choices. Therefore, as a finance professional, you need to learn it.
How to Perform Sensitivity Analysis as an FP&A Professional?
Do you want to master it?
Check these eight sensitivity analysis tables for a perfect illustration of what you can do to help your management. ( Source: FPANDA CLUB)
- Impact of price increase on “Profit in % of Sales.”
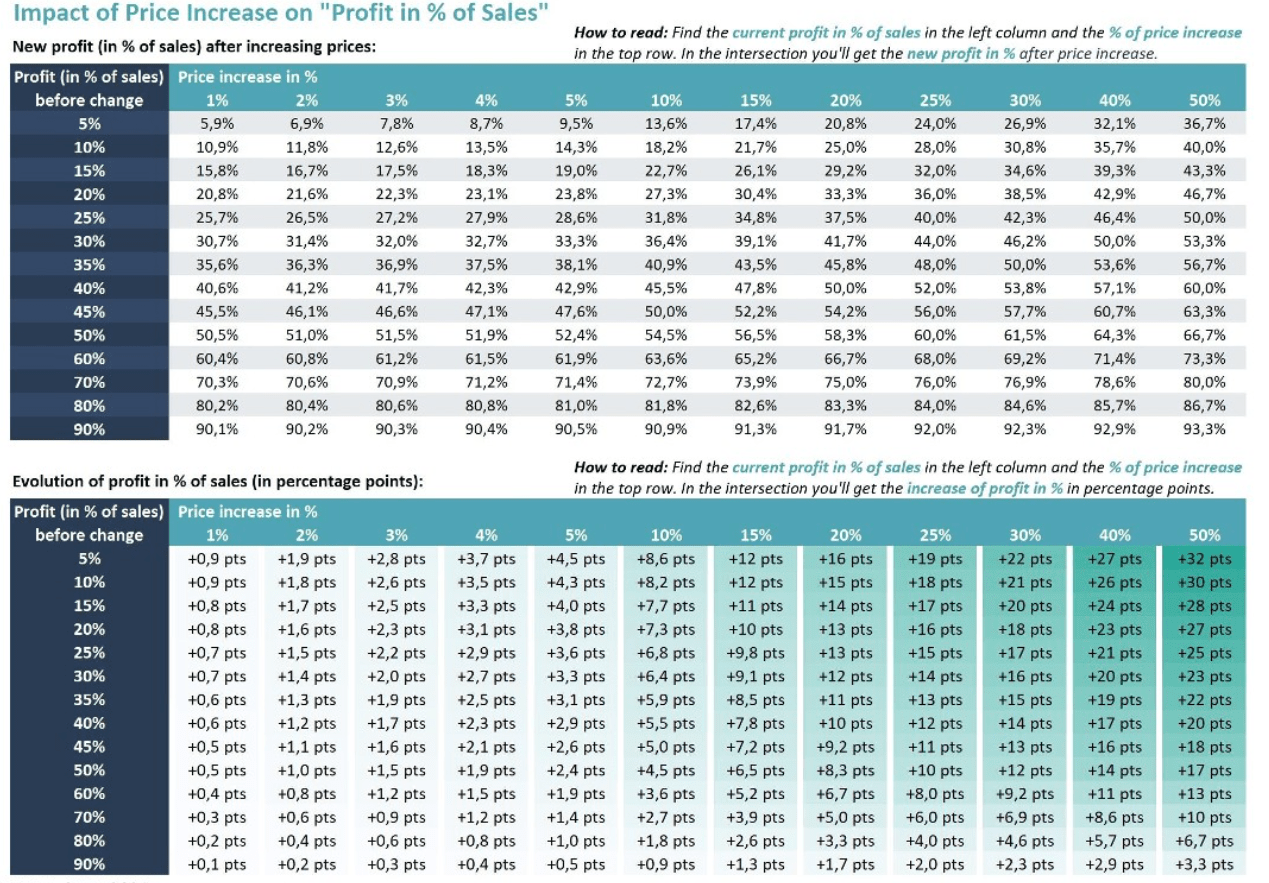
Source: FP&A club
- Price increase needed to grow the amount of profit by X%.
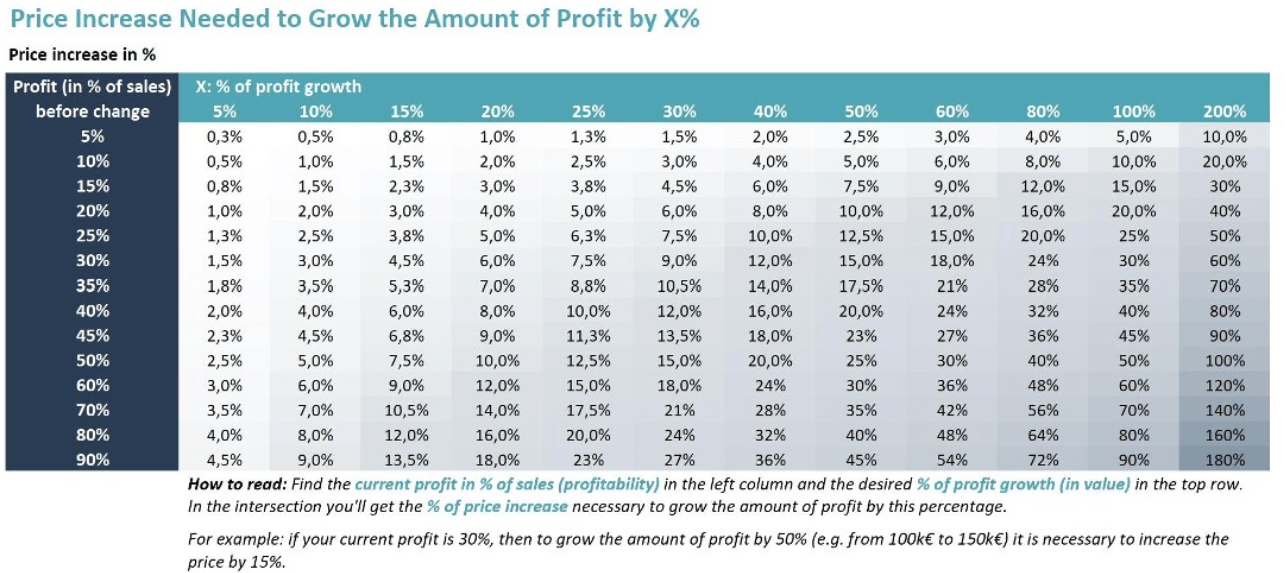
*(credits to FP&A club)
- Impact of price discounts on “Profit in % of Sales.”
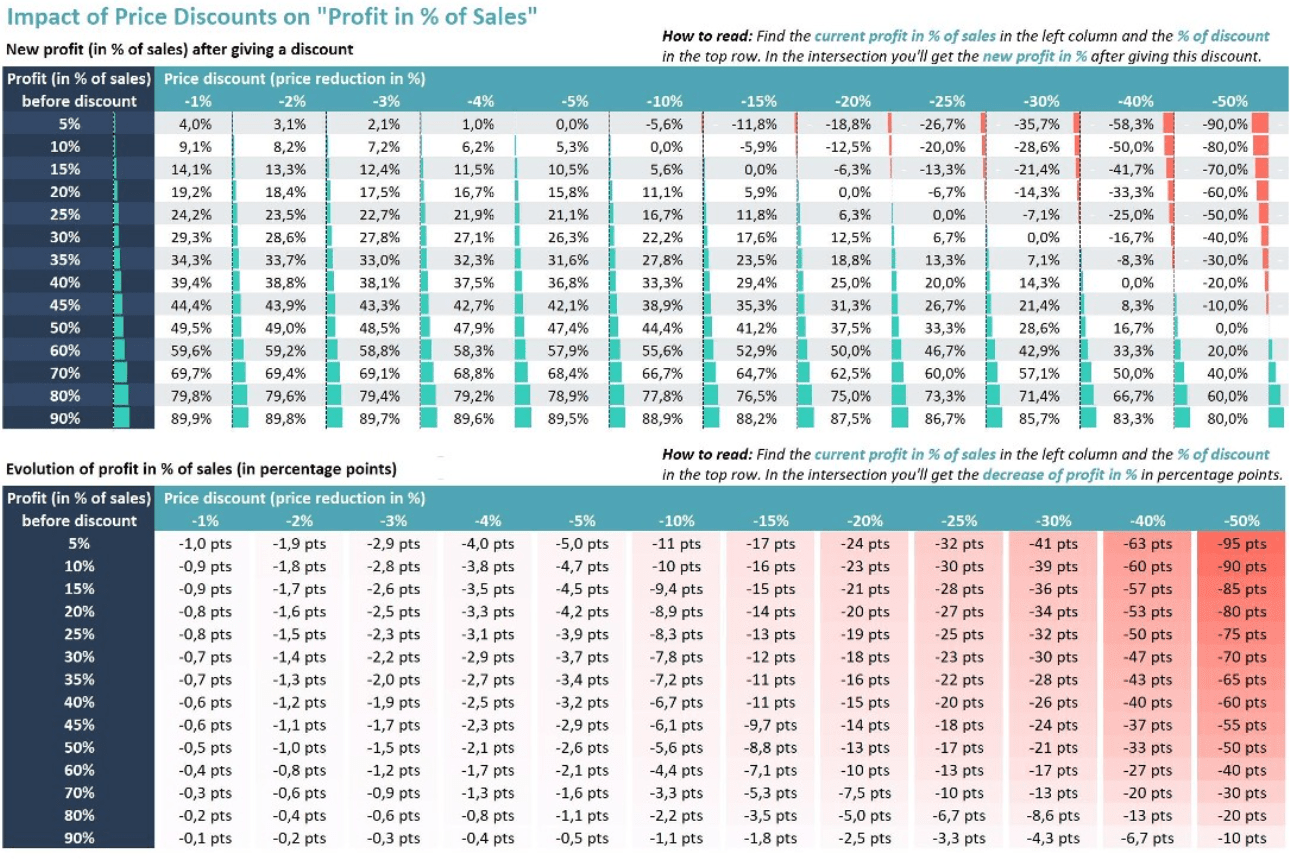
(credits to FP&A club)
- Compensations of price discounts by volume increase.
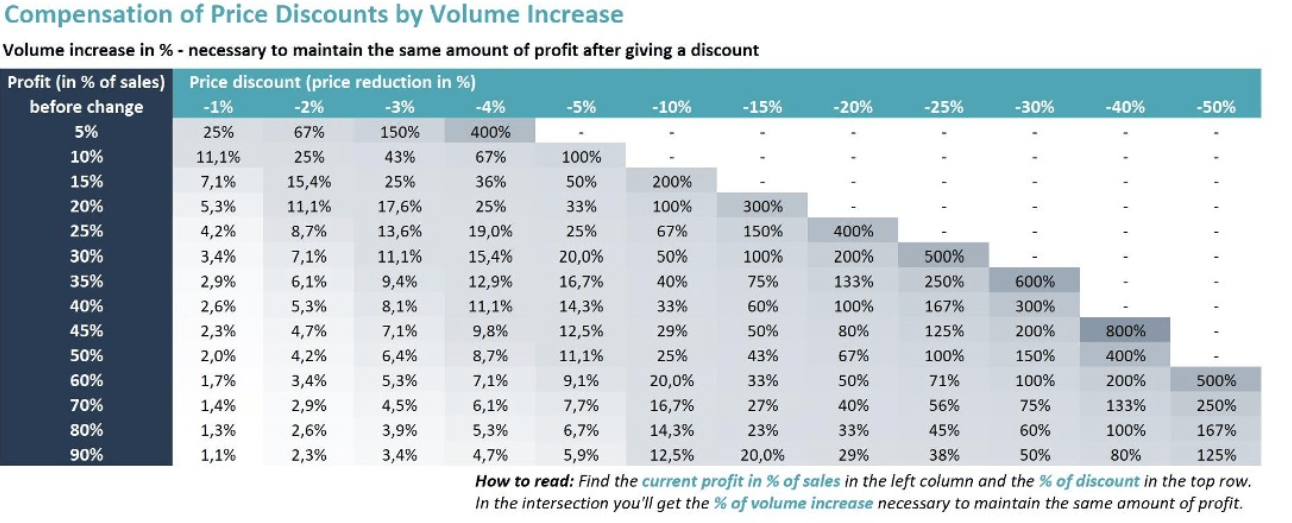
*(credits to FP&A club)
- Impact of cost variations on “Profit in % of Sales.”
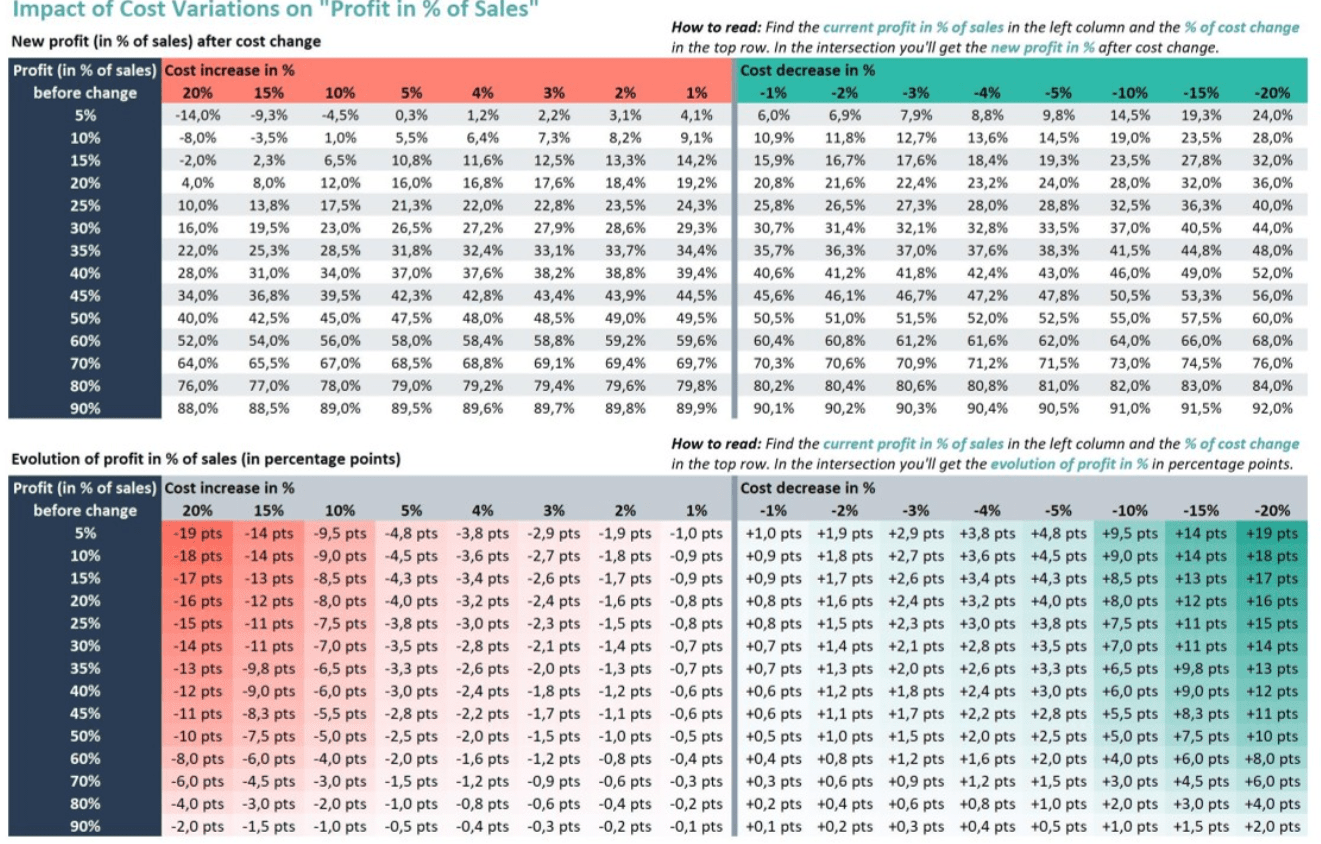
*(credits to FP&A club)
These tables created by Marina Gorodnicheva and Anna Oblakova, PMP®, Ph.D., from FPANDA CLUB show the impact on profit from:
- Price increase
- Price discount
- Volume increase
- Cost increase
- Cost decrease
My favorite table is the last one, where we can see the effect of the cost decrease needed to reach a certain profit. For example, if your profit is at 20% of sales, decreasing the costs by 3% will increase your profit by 2,4 points (new profit being 22,4%). Therefore, this can be really handy when management is asking for a sensitivity analysis during a meeting, and you can answer straight away by showing this table. Furthermore, with these tables, management and finance can set the appropriate target of cost reduction and/or price increase to reach the expected new profit level.
Advantages and Disadvantages of Sensitivity Analysis
Here are the pros and cons of performing a sensitivity analysis as an FP&A professional.
Pros
- It serves as a thorough examination of the variables’ behavior
- Typically results in more accurate forecasts
- Aids decision-makers in determining where they need to improve the financial model in subsequent versions
- Tests any economic model under a variety of scenarios, giving it more credibility
- Displays how sensitive the outcome is to variations in particular values.
Cons
- All results are based on assumptions about historical data, which renders them prone to error.
- Analyzing the interactions and correlations between variables, as well as any potential effects, is impossible when we consider each element separately
Benefits of Using Sensitivity Analysis
Management can receive a variety of relevant input from financial models that include sensitivity analysis in a variety of situations. Here are some of the benefits of performing Sensitivity analysis:
- Identifying the influencing elements. This covers what and how various outside circumstances affect a particular project or endeavor. As a result, management is better equipped to grasp how input factors could affect output factors.
- Minimizing uncertainty. Comprehensive sensitivity analysis models teach users about the various factors that have an influence on a project, which in turn tells project participants what to watch out for or what to prepare for in advance.
- Detecting mistakes. There could have been some undiscovered flaws in the initial hypotheses for the baseline study. As a result, management may identify errors in the first analysis by carrying out several rounds of the analysis.
- Making the model simpler. Analyzing the inputs may be challenging for comprehensive models. Therefore, users may learn more about what components don’t really important and can be eliminated from the model owing to their lack of materiality by undertaking sensitivity analysis.
- Delivering outcomes. Upper management can already be on the defensive or curious about a project. However, putting together an analysis of many scenarios helps decision-makers learn about other solutions.
- Reaching objectives. Long-term strategic plans may be established by management, and they must reach certain criteria. In other words, a corporation may understand better how a project might evolve and what circumstances must exist for the team to accomplish its metric objectives by undertaking sensitivity analysis.
Conclusion – Understanding Sensitivity Analysis as an FP&A Professional Gives You an Advantage
To sum up, every FP&A professional should include sensitivity analysis in his toolbox. Above all, it reveals the model’s flaws in further detail. Additionally, it reveals how responsive the selected optimal solution is to changes in the input values of one or even more independent variables.
Ultimately, if you want to broaden your financial knowledge and learn new analyses, tips, and insights, you can take my course and emerge in the finance world.