How can you identify the reasons for the differences between your actual and budgeted sales?
There is one method that you need to know if you are an FP&A analyst: it is the PVM analysis. Thanks to this method, you can break down changes in revenue or margins into their constituent parts.
As a result, this analysis displays the discrepancies between projected and actual sales, along with the three key elements that may play a huge factor:
- Price effect
- Volume effect
- Mix effect.
Here is a detailed analysis of the best analysis method for FP&A.
Table of Contents
Definition of PVM Analysis Method
PVM stands for Price Volume Mix. This analysis helps you compare two periods or actuals vs. budget. Therefore, it gives you the origin of variance.
Also, PVM helps you to know how much change comes from:
- Price
- Volume
- Mix
Prerequisite
You need to have the same level of detail in the two periods you compare.
The level of details could be:
- product
- country
- distribution channel
You need to know the price, volume and % of total (weight) in each of the period, at the level of details you choose to analyze.
Price
The effect of price keeping quantity constants. For example, if volume and mix are constants, increasing the price by 10% on all products, will increase the revenue by 10%.
Volume
Selling more products, even at the same mix and price, will increase sales. For instance, if you sell 5% more of all products, with a constant price, you will have 5% more revenue.
Mix
Even keeping total quantities and prices the same, sales can increase if we sell a higher proportion of expensive products. For example, if you have 2 products:
- Standard desk: 500$ x 10 = 5,000$
- Electric desk: 2,000$ x 5 = 10,000$
- Total budget: 15,000$
Also, if in actuals, you sell:
- Standard desk: 500$ x 5 = 2,500$
- Electric desk: 2,000$ x 10 = 20,000$
- Total actuals: 22,500$
Consequently, the increase of 7,500$ comes 100% from a better mix as we sold more of a more expensive product. But we didn’t change the price and we sold the same volume of desks in total.
What Can You Detect with The PVM Analysis Method?
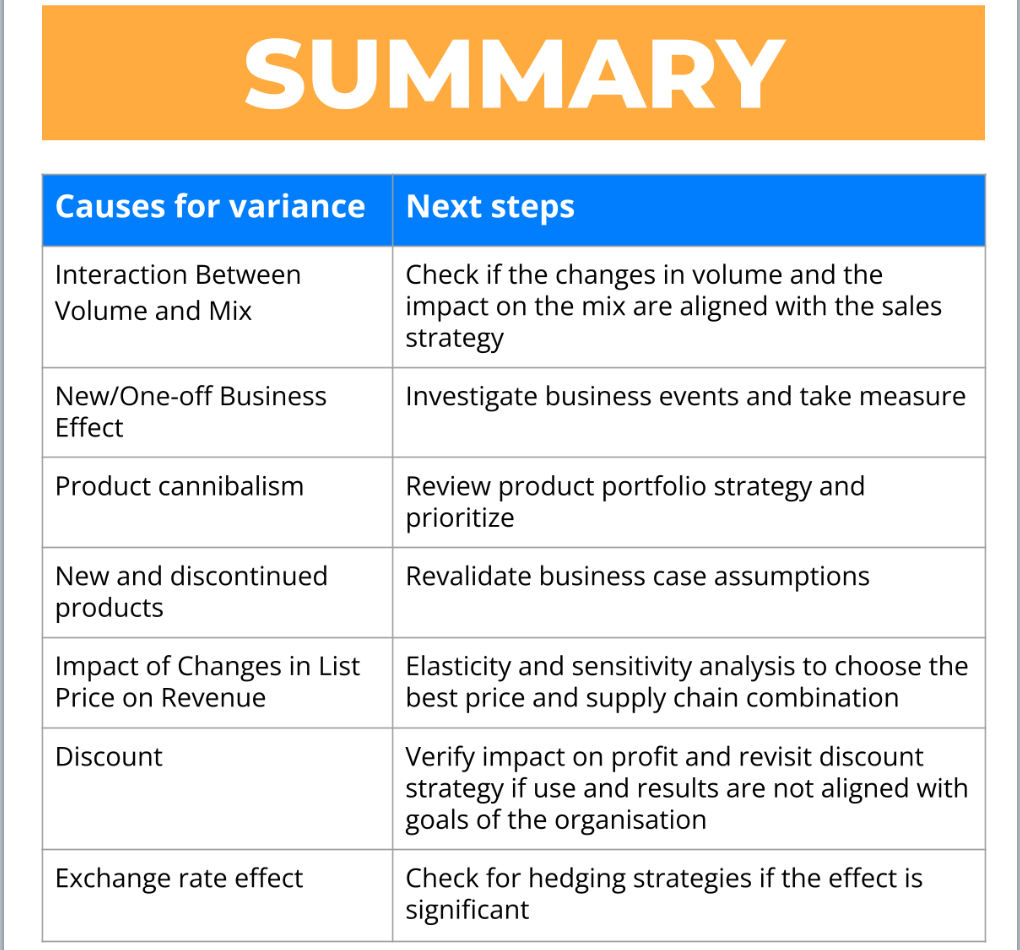
You detect an increase in volume with negative mix effect
Next step: Check if the changes in volume is really aligned with the product portfolio strategy and why we decide to sell more of the cheaper products.
There is a new or one-off business event
Next step: Investigate business events and take measures.
You notice product cannibalism
Next step: Review product portfolio strategy and prioritize.
Impact from new and discontinued products
Next step: Revalidate business case assumptions.
Price changes
Next step: First, validate the prices. After that, perform elasticity & sensitivity analysis to choose the best price and supply chain combination.
Discount effects
Next step: Verify impact on profit and revisit discount strategy if use and results are not aligned with goals of the organization.
Exchange rate impact
Next step: Check for hedging strategies if the effect is significant.
Here is a summary of the

Conclusion – PVM Analysis Method Is Crucial for FP&A
PVM is the best method to understand the origin of your variance. Additionally, you can use it on other lines than revenue (margin, cost, payroll…). Furthermore, with visualization you can use a waterfall chart to show the origins of the variances.
Did you learn something with this free guide? It’s extracted from my video course.
For each topic, I proceed the same way:
- Methodology
- Example
- Practical application
Finally, to continue learning, you can take my course.


