MY ESSENTIAL TOOLKIT FOR FINANCE PROFESSIONALS. Get it FREE today.

Tips

Learn 5 Excel Tips for Finance Professionals Today

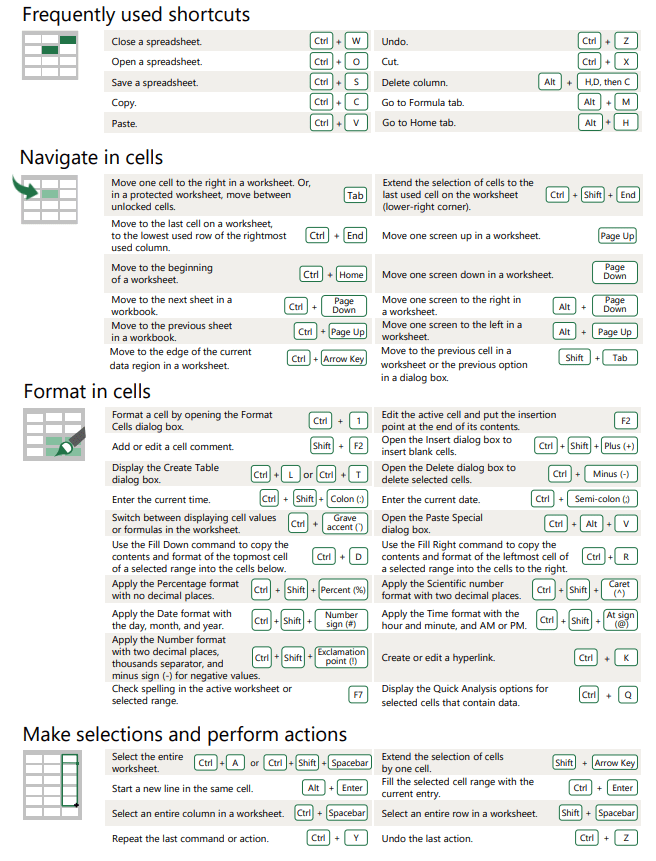
Do you want to increase your productivity and learn Excel tips for finance professionals? Using Excel is part of the routine for you if you’re like the majority of financial professionals. It is a tool that has been in use for a long time because of how well it can modify, preserve, and show data.

Despite the widespread usage of this application, not all financial professionals are using Excel to its full potential. Also, Excel can dramatically boost your productivity when you utilize a few simple strategies. Here are five Excel tips for finance professionals you should know as a financial expert using this potent tool out of the many beneficial Excel capabilities.

Top 5 Excel Tips for Finance Professionals

Here is a detailed explanation of each of the tips.

#1: Excel Tip for Finance Professionals

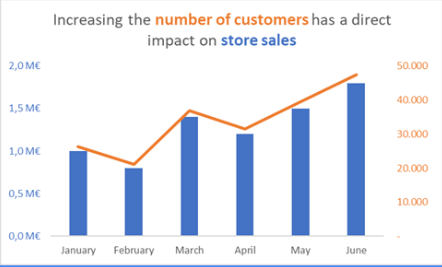
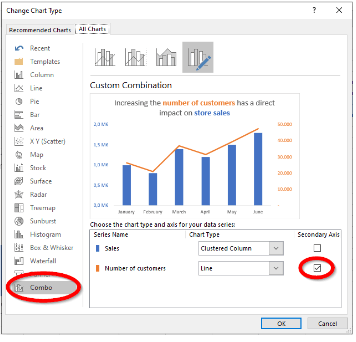
How to make a Combo Chart in Excel?

#1: Excel tip: example of a Combo Chart

OFFICE 2019

  1. Select your chart
  2. Then, go to Design in the Excel Ribbon
  3. Select Change Chart Type
  4. After that, Choose Combo
  5. Lastly, click secondary Axis
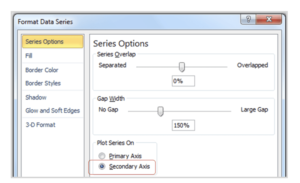
Example of a Comb Chart in Office 2010

OFFICE 2010

  1. Select one of the series in your chart
  2. Subsequently, right-click “Format Data Series”
  3. After that, select Secondary Axis
  4. Then, right-click again on the series and choose “Change series Chart type”
  5. Choose another chart type

Secondary axis Excel

#2: Excel Tip

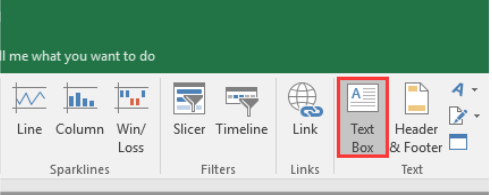
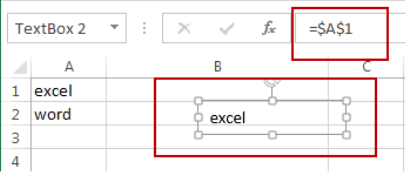
Learn how to link a Textbox to a specific cell in two easy steps.

1. Insert the Text Box

  • Click the Text Box button under the Insert tab.
  • Insert a textbox in your worksheet.

#2: Excel tip - Text Box

2. Type Formula

  • Select the text box.
  • Then, go to the formula bar.
  • Type in the “=” symbol.
  • Finally, click on the cell you want to link.

#2: Excel tip - typing Formula

#3: Excel Tip for Finance Professionals

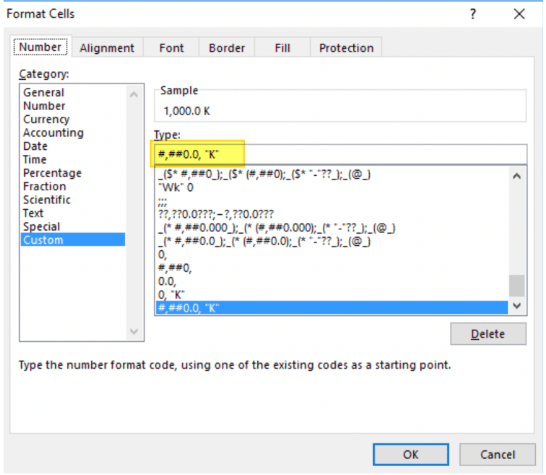
Reporting Figures in thousands and millions.

NEED

  • You have to report figures in thousands or in millions.
  • You are dividing your numbers by 1,000 or 1,000,000 to show your numbers in thousands or in millions.

HOW TO DO IT

  1. Select your cell with the number you want to show in thousands
  2. Afteward, Right-click and select “Format Cells”
  3. The “Format cells” dialog opens
  4. Go to the “Number” view
  5. Then, in the Category, select “Custom”
  6. After that, type or select the following format: #,##0
  7. Afterward, if you want to show thousands, add a comma at the end of the syntax: #,##0,
  8. Furthermore, if you want to show millions, add two commas at the end of the syntax: #,##0,,

EXAMPLE
#3 Excel tip example
Here are some bonus tips:
 #1:

  • If you want to show a k after the figures for thousands, use: #,##0,”k”
  • If you want to show a k after the figures for thousands, use: #,##0,,”m”

#2:

  • If you want to show decimals, use the following format: #,##0.0, (for thousands).

#3:

  • Use this technique to convert your numbers format in your Pivot tables value to have automated reports.
  1. In the Pivot Table, select one of the cells with the value you want to format
  2. Then, right-click and select “Value Field Settings”
  3. Furthermore, click Number Format at the bottom of the dialog box.
  4. In the Format Cells dialog box, in the Category list, click the number format that you want to use

#4: Excel Tip

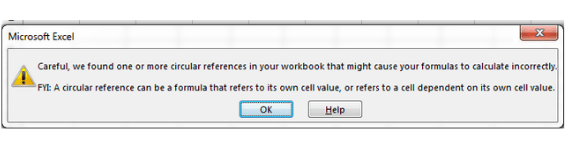
Learn how to solve Circular References.

NEED
Do you get Warnings from Excel about Circular References but never pay attention to them?

#4: Circular References

HOW TO DO IT
Just go to Excel Ribbon

  1. Click “Formulas”
  2. Click “Error Checking”
  3. Click “Circular references”

#4: Excel tip - how to do it

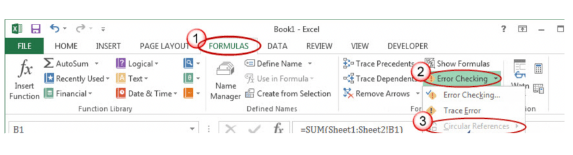
Then Excel shows you the list of cells with circular references if you have some.

#5: Excel Tip

Learn how to repeat Row Labels.

NEED
You have a table with row labels not repeated.
Problem: you can not use this table to make a pivot table.
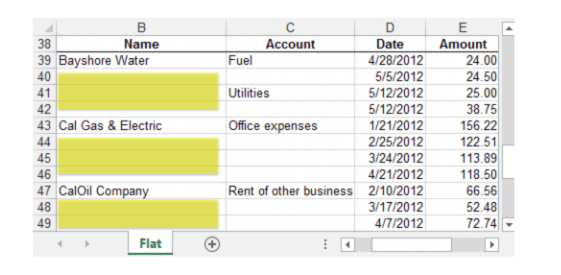
#5: Excel tip table
HOW TO DO IT

  1. Select the columns with the empty row labels.
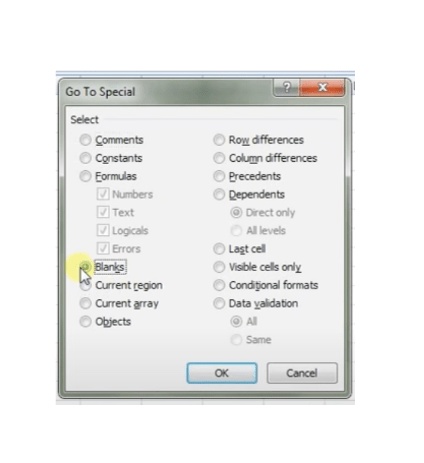
  2. Then, press the F5 function key
  3. Click Special…
  4. Afterward, select Blanks and click OK (all blank cells in the data will be selected)
  5. Press the = sign once and the UP arrow key once (you will see a formula appearing in a cell).
  6. Finally, press CTRL+ENTER to finish
  7. All the blank cells will now be filled in with the values. Note that they are all formulas and must be converted to values.
  8. Copy the entire range and paste it as a value

EXAMPLE

#5: Excel tip example
TOP 10 EXCEL SPECIALISTS TO FOLLOW

LEILA GHARANI
Leila created tutorial videos on the whole Microsoft Suite. I really like the ones on Excel and Powerpoint. Therefore, check her Youtube channel.

KAT NORTON
She is known as Miss Excel on Instagram and Tiktok. Moreover, Kat has a modern way of teaching Excel tricks and uses Instagram or Tiktok to communicate. Go check it.

PAUL BARNHURST
Paul is sharing his knowledge of FP&A, Excel, and Finance tools. In addition, he has great practical tips for finance professionals.

MATT BRATTIN
Matt is behind all the Excel free guides from TMB Analytics you can find on LinkedIn. Above all, he also publishes videos and has his own set of online courses.

CHRISTIAN WATTIG
Christian is one of the best experts on FP&A and gives practical tips on how to better use Excel when you are a finance professional.

KAREN ROEM
Karen is a trainer for Microsoft Office Suite and has a newsletter where she regularly shares productive tips (more than 700 tips listed to date!).

CHRIS REILLY
He is a financial modeling expert and even created a course on the topic! Furthermore, Chris an M&A and FP&A expert.

MIKE GIRVIN
Mike has his own Youtube channel, “Excel is Fun.” You will find their extended tutorials on Excel. Also, check his new 800 pages book!

DON TOMOFF
Don is regularly sharing tips on LinkedIn on Excel, PowerQuery, and other tools (he has already posted more than 700!).

JOHN MACDOUGALL
John has his own website called “How To Excel,” with many free Excel tips. Additionally, he sends a newsletter where you can receive his new tips.

The Bottom Line – Accelerate Your Finance Career with These Excel Tips for Finance Professionals

Finally, with these Excel tips for finance professionals, you’re on the right path to dominating Excel in your workplace. Still curious to know more? Additionally, if you want to learn more Excel tips and trick, you can take my course for finance professionals and become an expert.

Also, if you want to receive more finance tips like this, feel free to sign up for my newsletter. If you subscribe, every two weeks, you will receive an email from where I share best practices, career advice, templates, and insights for finance professionals.


Huge quantities of organized and unstructured data are gathered, processed, and analyzed by business intelligence tools in finance from internal and external systems.

There are many different types of data sources, such as raw files, ERP databases, emails, CRM data, archives, online data, and much more. Business Intelligence (BI) tools employ query to retrieve this data.

Then, they may be shown as reports, dashboards, charts, and graphs for ease of use. How can you make the best out of business intelligence tools when you work in finance?

10 Tips for Using Business Intelligence Tools in Finance

Here are my ten tips for you.

#1: What to Do When You Start?

Understand where you can get the tutorials and learning materials in your company and on the internet.

#2: Get An Understanding of The Data and Reports Available

Ask to see the library of data mapped, standard reports, and customized reports to have a quick feel of the possibilities.

#3: Learn from Others

Document the list of reports your colleagues are using, and for each of them, make sure you also note which parameters to use cubes, date, and filter.

#4: Identify the Key Users

Get to know the key users within your department but also from the other teams. Furthermore, this is a great way to learn from others and get some help if you are stuck with one report.

#5: Influence the key stakeholders

Influence the IT team and key users from your company to move some of your priorities to the top of the agenda. Therefore, the best way is to participate in key meetings. But also to do one-to-one meetings as well as draft proposals.

#6: Use Every Request as A Way to Leverage The Business Intelligence Tools

Each time people ask you for information, show existing reports they have at their disposal. As a result, create for them ad hoc reports they can receive per email and/or consult when they need it.

#7: Accept The Imperfection of A Solution

Accept the imperfection of the BI solution and embrace the time and value you get (single source of truth, consolidation, versioning, collaboration).

#8: Increase Awareness

Explain to others what the tool can and not do: increase awareness and decreases frustration.

#9: Don’t Use The Business Intelligence Tools as An Excuse to Hide Other Problems

Often critics of a tool are the tip of the iceberg showing communication problems and issues in the processes. Therefore, solve them before trying to change the tool.

#10: Learn The Best Practices from Other Organizations

Participate in webinars and conferences, connect with BI specialists on LinkedIn, and learn what the best practices are.

Conclusion – The Importance of Using Business Intelligence Tools

Ultimately, the secret to boosting profitability and securing overall business success will depend on the proper data gathering and analysis.

The best approach to obtaining data from many sources and extrapolating relevant, business-enhancing information is to use business intelligence tools. But it’s crucial that you pick and use the appropriate BI tool for your company.

If you want to receive more finance tips like this, feel free to sign up for my newsletter. If you subscribe, every two weeks, you will receive an email from where I share best practices, career advice, templates, and insights for finance professionals.

Learn about the Top Ten Manufacturing (KPIs) Key Performance Indicators that every finance professional must know. In other words, these metrics are crucial for understanding your bottom line and projecting for the future.

10 Manufacturing KPIs

Top 10 Manufacturing KPIs

Here are the top ten manufacturing KPIs you need to learn in finance.

#1: Manufacturing KPIs – Production Activity (or Volume)

Description: Calculates the value of the production output in monetary value.
Formula: Sum of the monetary value of all finished goods produced within a defined period.

#2: Cycle Time

Description: Average amount of time to make one product, including process, inspection, move, and queue time.
Formula: Process time + Inspection time + Move time + Queue time

#3: Manufacturing KPIs – Takt time

Description: Rate at which you need to complete a product to meet customer demand.
Formula: Production available time / Customer demand

#4: Inventory Turnover

Description: Amount of time that passes from the day an item is purchased by a company until it is sold.
Formula: Cost of Goods Sold / Average Inventory (over a period of time)

#5: Manufacturing KPIs – Return on Assets (ROA)

Description: Measures how effectively a company is using its resources (machine and inventory) to make a profit.
Formula: Net Income / Average Total Assets

#6: First Pass Yield

Description: Measure of quality and performance and is at the heart of production efficiency and profitability.
Formula: Number of good products finished / Number of production orders started

#7: Manufacturing KPIs – Yield Factor

Description: Calculates the number of items to start to have a good finished product.
Formula: Number of production orders started / Number of good products finished

#8: Overall Equipment Effectiveness (OEE)

Description: Compares the performance of a machine to its relative capacity
Formula: Good Count × Ideal Cycle Time / Planned Production Time

#9: Manufacturing KPIs – On-Time Delivery

Description: Measures if an organization is meeting its goals in regard to promised delivery times
Formula: On-time units / Total units

#10: Avoided Costs

Description: How much money have you saved by using preventive maintenance?
Formula: Assumed Repair Cost + Production Losses – Preventative Maintenance Cost

The Bottom Line – The Manufacturing KPIs are The Key to Successful Manufacturing Operation

To sum up, in order to ensure the success of a Manufacturing Operation, it is important to monitor a variety of KPIs. By doing so, businesses can identify areas where improvements can be made in order to boost efficiency and productivity.

Ultimately, take my online course and gain valuable knowledge on how you can become a successful financial professional! Also, unlock the key to reaching your career goals!

Microsoft Office is a collection of desktop productivity tools created primarily for corporate usage. It was originally made available in 1990 and is a Microsoft Corporation proprietary software.

Therefore, in terms of providing contemporary office-related document-handling software environments, Microsoft Office has long been the industry standard.

I just discovered this immense catalog of tips made by Karen Roem. This is a collection of more than 650 tips (654 tips at the date of this post) to make you better at all the Windows and Microsoft Office tools.

Here are my favorite three tips for Microsoft Office from Karen:

Top 10 Microsoft Outlook shortcuts

  1. CTRL + 1 and CTRL + 2 – Toggle between mail and calendar
  2. CTRL + F – Forward a mail message
  3. CTRL + G – Go to a specific date
  4. CTRL + K – Check names in address fields and resolve them against the address book
  5. CTRL + K – Insert Hyperlink
  6. CTRL + SHIFT + 8 – Show/hide paragraph marks and other hidden formatting symbols
  7. F3 – AutoComplete Quick Parts
  8. F4 – Find text in an email message
  9. SHIFT + F1 – Reveal Formatting
  10. SHIFT + F3 – Toggle between upper case, lower case, and sentence case

Create a bulleted list in Excel

  1. Select the cell where the list is to appear.
  2. After that, press ALT + 7 on the numeric keypad.
  3. Then, type your text.
  4. Press ALT + ENTER if you want to insert another bullet in the same cell.
  5. Additionally, repeat steps 2 – 4.

Shortcuts in Microsoft Office Windows

WIN + D can be used as a toggle to minimize and maximize all windows. But what if you just want to have a quick peek at something on your desktop? Check out the preview shortcut!

Here’s how:

  1. Firstly, press and hold down the WIN key (the one next to your spacebar) and press the spacebar.
  2. Afterward, release the WIN key to return to your last used window.

The Final Verdict – Understanding Microsoft Office Apps Is A Must!

These shortcuts can benefit you hugely in your everyday tasks in Microsoft Office. Therefore, it is important to know how to implement them. If you like this post, you can also check these Excel tips.

If you want to receive more finance tips like this, feel free to sign up for my newsletter. If you subscribe, every two weeks, you will receive an email from where I share best practices, career advice, templates, and insights for Finance Professionals.

Five whys (or 5 whys) is an iterative interrogative technique used to explore the cause-and-effect relationships underlying a particular problem.

The primary goal of the technique is to determine the root cause of a defect or problem by repeating the question “Why?”. Each answer forms the basis of the next question. The “five” in the name derives from an anecdotal observation of the number of iterations needed to resolve the problem.

The method provides no hard and fast rules about what lines of questions to explore or how long to continue the search for additional root causes. Thus, even when the method is closely followed, the outcome still depends upon the knowledge and persistence of the people involved.

Origin

Sakichi Toyoda, the Japanese industrialist, inventor, and founder of Toyota Industries, developed the 5 Whys technique in the 1930s. It became popular in the 1970s, and Toyota still uses it to solve problems today.

Toyota has a “go and see” philosophy. This means that its decision-making is based on an in-depth understanding of what’s actually happening on the shop floor rather than on what someone in a boardroom thinks might be happening.

The 5 Whys technique is true to this tradition, and it is most effective when the answers come from people who have hands-on experience with the process or problem in question.

Also, the method is remarkably simple: when a problem occurs, you drill down to its root cause by asking “Why?” five times. Then, when a countermeasure becomes apparent, you follow it through to prevent the issue from recurring.

Example of The 5 Whys

Delays in sales in a production company:

  1. Why is the turnover lower by 20% when you compare it with the budget?

It’s because we have delays on two major projects.

  1. Why?

Because it takes more time to build the product as normal.

  1. Why?

It is that it is a new product, and there are new technical requirements that need modification before production.

  1. Why?

Because the feasibility of the new technical requirements was not validated beforehand with the production.

  1. Why?

Because to reduce the price and satisfy the client’s demand, we changed the design at the last minute without following the normal process of validating these design changes with the production.

Conclusion

You can complete the 5 Whys test most easily by writing it down on a sheet of paper. The fishbone or the Ishikawa diagram, however, might be useful when first detecting issues.

The graphic may highlight issues that require a closer examination using the five whys. You can gather the links between the underlying causes and their effects. Then, you can assess which of them had the most influence on the initial issue.

If you want to receive more finance tips like this, feel free to sign up for my newsletter. If you subscribe, every two weeks, you will receive an email from where I share best practices, career advice, templates, and insights for Finance Professionals.

Imagine you could calculate how long it takes to double your money just with a simple formula. Have you heard about the Rule of 72?

The Rule of 72 is a simple, effective rule frequently used to determine how many years are needed to double an investment at a specific yearly rate of return. Also, it can figure out how many years it will take to double an investment by calculating the yearly rate of compounded return.

How to Calculate The Rule of 72?

You just need to divide 72 by the rate of return to determine the Rule of 72. Depending on how the interest rate is stated, you may use the method to get the doubling time in days, months, or years. If you enter the annual interest rate, for instance, you will see how many years it would take for your assets to double.

Example:

  • What is the doubling time for an investment with a compound interest rate of 8%?
  • A person using the Rule of 72 equation would find the doubling time equal to 9 years.
  • Then, calculate this by taking 72 and dividing it by 8.
  • By performing this, the investor can tell that it will take approximately nine years to double the principal.
  • It is fairly accurate as the exponential function yields an actual doubling time of 9.006 years.

How to Use It?

Anything that increases at a compound rate, such as the population, macroeconomic data, fees, or loans, might be subject to the Rule of 72. The economy will double in 72 / 4% = 18 years if the gross domestic product (GDP) rises at 4% per year.

Therefore, you can use The Rule of 72 to show the long-term implications of these charges concerning the fee that reduces investment profits. In around 24 years, a mutual fund with yearly cost fees of 3% will have cut the invested principal in half.

Therefore, a credit card user who pays 12% interest (or any other loan type that charges compound interest) will double their debt in six years.

The Bottom Line

In short, The Rule of 72 provides investors with a quick and simple technique to forecast the growth of their assets. Additionally, this Rule brilliantly illustrates the power of compounding for accumulating wealth. How? By demonstrating how rapidly you can double your money with little effort.

Finally, if you want to expand your financial knowledge with more tips, you can take my course.

Numerous keyboard shortcuts that Excel provides can help you operate more quickly and productively. More importantly, significant operations may be carried out with just two or three keystrokes rather than using the mouse to enter the toolbar. Isn’t that quicker and easier? Excel shortcuts significantly speed up work and cut down on the workload.

Therefore, Microsoft compiled 50 time-saving Excel Shortcuts (for Windows), which I will discuss today.

Time-Saving Excel Shortcuts

Here are the four types of time-saving Excel shortcuts.

Table in green and white colors of the 50-time saving Excel shortcuts.

Frequently Used Excel Shortcuts

Table of the Frequently Used Shortcuts

  • Close a spreadsheet – Ctrl + W
  • Undo – Ctrl + Z
  • Open a spreadsheet – Ctrl + O
  • Cut – Ctrl + X
  • Save a spreadsheet – Ctrl + S
  • Delete column – Alt + H, D, then C
  • Copy – Ctrl + C
  • Go to Formula tab – Alt + M
  • Go to the Home tab – Alt + H
  • Paste – Ctrl + V

Navigate in Cells

Table of Excel Shortcuts "Navigate in Cells"

  • Move one cell to the right in a worksheet. Also, in a protected worksheet, move between unlocked cells – Tab
  • Move to the last cell on a worksheet, to the lowest used row of the rightmost used column – Ctrl + End
  • Move to the beginning of a worksheet – Ctrl + Home
  • Move to the next sheet in a workbook – Ctrl + Page Down
  • Move to the previous sheet in a workbook – Ctrl + Page Up
  • Move to the edge of the current data region in a worksheet – Ctrl + Arrow Key
  • Extend the selection of cells to the last used cell on the worksheet (lower-right corner) – Ctrl + Shift + End
  • Move one screen up in a worksheet – Page Up
  • Move one screen down in a worksheet – Page Down
  • Move one screen to the right in a worksheet – Alt + Page Down
  • Move one screen to the left in a worksheet – Alt + Page Up
  • Move to the previous cell in a worksheet or the previous option in a dialog box – Shift + Tab

Format in Cells

Excel Shortcuts about "Format in Cells"

  • Format a cell by opening the Format Cells dialog box – Ctrl + 1
  • Add or edit a cell comment – Shift + F2
  • Display the Create Table dialog box – Ctrl + L or Ctrl + T
  • Enter the current time – Ctrl + Shift + Colon (:)
  • Switch between displaying cell values or formulas in the worksheet – Ctrl + Grave accent (`)
  • Use the Fill Down command to copy the contents and format of the topmost cell of a selected range into the cells below – Ctrl + D
  • Apply the Percentage format with no decimal spaces – Ctrl + Shift + Percent (%)
  • Apply the Date Format with the day, month, and year – Ctrl + Shift + Number sign (#)
  • Apply the Number format with two decimal spaces, thousands separator, and minus sign (-) for negative values – Ctrl + Shift + Exclamation point (!)
  • Check spelling in the active worksheet or selected range – F7
  • Edit the active cell and put the insertion point at the end of its contents – F2
  • Open the Insert dialog box to insert blank cells – Ctrl + Shift + Plus (+)
  • Open the Delete dialog box to delete selected cells – Ctrl + Minus (-)
  • Enter the current date – Ctrl + Semi-colon (;)
  • Open the Paste Special dialog box – Ctrl + Alt + V
  • Use the Fill Right command to copy the contents and format of the leftmost cell of a selected range into the cells to the right – Ctrl + R
  • Apply the Scientific number format with two decimal spaces – Ctrl + Shift + Caret (^)
  • Apply the Time Format with the hour and minute, and AM or PM – Ctrl + Shift + At Sign (@)
  • Create or edit a hyperlink – Ctrl + K
  • Display the Quick Analysis options for selected cells that contain data – Ctrl + Q

Make Selections and Perform Actions

  • Select the entire worksheet – Ctrl + A or Ctrl + Shift + Spacebar
  • Start a new line in the same cell – Alt + Enter
  • Select an entire column in a worksheet – Ctrl + Spacebar
  • Repeat the last command or action – Ctrl + Y
  • Extend the selection of cells by one cell – Shift + Arrow Key
  • Fill the selected cell range with the current entry – Ctrl + Enter
  • Select an entire row in a worksheet – Shift + Spacebar
  • Undo the last action – Ctrl + Z

Table of the 50 Excel time saving shortcuts

The Bottom Line – Excel Shortcuts Are A Huge Boost for Productivity

Using Excel shortcuts, or shortcut keys is a sometimes neglected way to increase efficiency while working with an Excel model. Furthermore, there are various keyboard shortcuts for Excel that may be utilized to boost productivity. First, start by using these 50 shortcuts, and you’ll see the difference right away.

Furthermore, if you want to receive more finance tips like this, feel free to sign up for my newsletter. If you subscribe, every two weeks, you will receive an email from where I share best practices, career advice, templates, and insights for Finance Professionals.

Key Takeaways

  • Excel provides numerous keyboard shortcuts that can significantly enhance speed and productivity.
  • Excel shortcuts allow for quick execution of operations, reducing reliance on mouse interactions.
  • Microsoft has compiled 50 time-saving Excel shortcuts for Windows users.
  • These shortcuts are categorized into frequently used functions, cell navigation, cell formatting, selections, and actions.
  • Utilizing Excel shortcuts can greatly improve efficiency and productivity while working on Excel models.

FAQ

1. What is the significance of Excel shortcuts?

  • Excel shortcuts offer a quicker and more efficient way to perform tasks, reducing the reliance on manual mouse-based interactions and boosting overall productivity.

2. How many Excel shortcuts are covered in the list?

  • The list comprises 50 Excel shortcuts that encompass frequently used functions, cell navigation, formatting, selections, and various actions.

3. How are the Excel shortcuts categorized?

  • The Excel shortcuts are categorized into four types: frequently used functions, cell navigation, formatting in cells, and making selections and performing actions.

4. How can Excel shortcuts be beneficial for users?

  • Utilizing Excel shortcuts streamlines the work process, allowing users to perform tasks with just a few keystrokes. This can save time, reduce repetitive actions, and enhance overall efficiency.

Excel Charts assist you in displaying your data in a variety of appealing styles, including columns, lines, bars, pies, and areas, among others. It’s always about how we display the data that determines how fantastic a result we can produce with it. Excel charts and various bar graphs are helpful in this regard. In order to show our data as effectively as possible, we may also alter our graphs in Excel.

You can customize your Excel charts at all times to make sure your data is presented as persuasively as possible. And when I refer to personalization, I am not referring to significant major changes. I am speaking about an excellent tutorial from Microsoft. You get ten tips to make charts in a faster and simpler way.

Top 10 Tips for Excel Charts

This tutorial trains you with the following tips:

  1. Quick Chart Creation: Learn to instantly bring your data to life using the ALT+F1 shortcut, saving precious time in your financial analysis.
  2. Selective Visualization: Master the art of selecting specific columns before chart creation, ensuring that only the most relevant data is showcased for your financial storytelling.
  3. Dynamic Expansions: Discover how to automatically expand your graphs as you add more columns or rows, keeping your financial charts always up-to-date without manual adjustments.
  4. Efficient Data Filtering: Gain insights on quickly filtering data directly from a chart, enabling you to focus on specific financial metrics or periods without altering your entire dataset.
  5. Leveraging PivotCharts: When your data isn’t summarized, PivotCharts become an invaluable tool for creating dynamic visual representations of complex financial data.
  6. Multi-level Labels: Enhance readability with multi-level labels, perfect for organizing detailed financial data into clear and understandable charts.
  7. Secondary Axis Utilization: Learn to create compelling combo charts using a secondary axis, which is ideal for comparing different types of financial data on the same chart.
  8. Dynamic Chart Titles: Connect your chart titles to spreadsheet cells, allowing for automatic updates and ensuring that your financial presentations are always accurate.
  9. Pie Chart Insights: Split off slices into a second pie chart for a detailed examination of specific segments, enhancing the clarity of financial distributions.
  10. Interactive Previews: Utilize the hover feature over Chart Elements for a real-time preview, making it easier to fine-tune your financial charts before finalizing them.

How Can Excel Charts Improve Your Work

In finance, where data drives decisions, Excel charts stand out as not merely tools for data visualization but as essential instruments for analysis, communication, and strategy. Understanding how to leverage Excel charts effectively can significantly enhance your work by:

  • Enhancing Data Comprehension: Complex financial data becomes more digestible when presented visually. Excel charts help break down intricate datasets into understandable formats, making it easier to identify trends, patterns, and outliers.
  • Facilitating Better Decision-Making: By visualizing financial data, you can make informed decisions swiftly. Charts allow for a quick comparison of different data points, enabling financial analysts and decision-makers to identify potential investment opportunities or financial risks at a glance.
  • Improving Communication: Financial reports filled with numbers and text can be daunting. Excel charts offer a way to convey the same information more effectively, making it easier for stakeholders to grasp key messages and insights without getting lost in the details.
  • Saving Time: With the capability to quickly generate and customize charts, Excel allows for efficient data presentation. This means less time creating reports and more time on analysis and strategy.
  • Increasing Accuracy: Visual representations help in spotting errors in data that might not be evident in a tabular format. By plotting financial data on a chart, inconsistencies or anomalies become more apparent, leading to more accurate financial analysis.
  • Customizing for Impact: Excel’s wide range of chart types and customization options means you can tailor your data presentation to your specific audience. Whether it’s a line chart to demonstrate financial trends over time or a pie chart to show budget allocations, Excel charts can be customized to achieve the desired impact.

Conclusion

You may start making better-looking charts in Excel more quickly and efficiently by using the charting tips and methods. However, these tips and techniques are just a portion of the material I provide in my customized course for finance professionals, where I teach them how to produce understandable visual representations of financial data and valuable finance knowledge.

You can get the tutorial Excel file by clicking here and start training yourself to improve making charts in Excel and if you want to improve your productivity in Excel, grab my free top 100 Excel tips.

FAQ

1. What are the key benefits of using Excel charts in financial analysis?

  • Excel charts offer several key benefits in financial analysis, including enhancing data comprehension by breaking down complex datasets into visual formats, facilitating quicker decision-making through visual comparison of different data points, improving communication with stakeholders by presenting data in a more digestible manner, saving time on report creation, increasing the accuracy of financial analysis by making inconsistencies more apparent, and allowing customization to tailor presentations to specific audiences.

2. How can I quickly create a chart in Excel for my financial data?

  • You can quickly create a chart by selecting your data and pressing the ALT+F1 shortcut. This instantly generates a chart, bringing your data to life and saving precious time in your financial analysis. This shortcut is particularly useful for rapid visualization of financial trends and metrics.

3. Can Excel charts automatically update when I add more data?

  • Yes, Excel charts can automatically update as you add more columns or rows to your dataset. This feature, known as dynamic expansions, ensures that your financial charts remain up-to-date without the need for manual adjustments. It’s particularly useful for financial analysts who continuously update their data with new financial periods or metrics.

4. How can I use Excel charts to improve communication in my financial reports?

  • Excel charts improve communication by converting complex financial data into visually appealing and understandable formats. This makes it easier for stakeholders to grasp key messages and insights without delving into dense numerical data. By using charts, you can highlight trends, patterns, and anomalies in your financial data, making your reports more effective and engaging.

5. What is a PivotChart, and when should I use it in finance?

  • A PivotChart is an advanced Excel tool that allows you to create dynamic visual representations of complex datasets. It’s especially valuable when your data isn’t summarized and you need to analyze it from different perspectives. In finance, PivotCharts are useful for summarizing large amounts of financial data, such as sales figures, financial performance indicators, or investment returns, enabling you to drill down into specifics and uncover insights that would be difficult to spot in traditional charts.

You need to use Excel in your everyday job if you want to manage massive amounts of data. However, there are still a lot of helpful Excel tips and tricks that are definitely missed.

Even if you think that you have mastered Excel, I recommend you to visit the website of John MacDougal, “How to Excel,” where you will certainly learn something which will help your productivity (and will give you the possibility to impress your colleagues’ thanks to your new Excel skills).

Therefore, here is one of the best posts where he presents a compilation of the best Excel tips and tricks ranging from beginner to pro that will save you time and make you more productive.

Excel Tips and Tricks

Here is just one new trick that I learned today.

If you right-click and drag a range instead of the usual left-click, then you’ll able to do more than just cut and paste. In addition, a whole menu of advanced options is available.

  • Move Here – This will cut and paste the selection to the new location.
  • Copy Here – This will copy and paste the selection to the new location.
  • Copy Here as Values Only – This will copy and paste only the values to the new location.
  • Copy Here as Formats Only – This will copy and paste only the formatting to the new location.
  • Link Here – This will create a simple cell reference formula for the old location in the new location.
  • Create Hyperlink Here – This will create a hyperlinked cell reference to the old location in the new location.
  • Shift Down and Copy – This will copy and paste the selection to the new location and shift down any previous data in the new location.
  • Shift Right and Copy – This will copy and paste the selection to the new location and shift right any previous data in the new location.
  • Shift Down and Move – This will cut and paste the selection to the new location and shift down any previous data in the new location.
  • Shift Right and Move – This will cut and paste the selection to the new location and shift right any previous data in the new location
  • Cancel – This will cancel the action

The Bottom Line – Mastering Excel Is Necessary

In conclusion, mastering Excel tips and tricks can greatly improve your productivity and efficiency when working with spreadsheets. Therefore, by learning how to use functions and formulas, create graphs and charts, and utilize keyboard shortcuts, you can save time and effort when working with data in Excel.

If you want to receive more finance tips like this, feel free to sign up for my newsletter. As a result, if you subscribe, every two weeks, you will receive an email from which I share best practices, career advice, templates, and insights for Finance Professionals.

The connections between the financial statement items and the main value drivers of a firm are graphically shown in a value driver tree. The tree aids analysts in determining which factors are most crucial to the company’s total value and in monitoring the effects of changes to those factors. You can use the value driver tree to help the firm discover possible risks and opportunities.

How Can You Create A Value Driver Tree (VDT)?

The firm is broken down into its core business units or products, and then each business unit is further broken down into its primary value drivers to create the tree.

Most importantly, In his deep dive post “Value Driver Modelling“, Reuben Kearney lists the different uses of a Value Driver Tree (VDT) and offers a template to build your own VDT. Here are the different uses.

  • Identify where the biggest constraints are in an organization’s ability to create value.
  • You can use it in conjunction with sensitivity analysis to show which areas are at greatest risk for failing to deliver value.
  • Different investment options to find the optimal combination for creating value.
  • To provide transparency at the individual employee level to see how they contribute to the creation of value.
  • Allows you to benchmark operations that were previously too distinct to compare through traditional benchmarking methodologies.

Some software provide a tool to create a dynamic visualization of the VDT of a company. Therefore, here is an example from SAP :

And here is a concrete example with a comparison between two different scenarios:

The Bottom Line – VDT can Assist You in Many Ways

It takes time and effort to implement Value Driver Trees. But I’ve discovered it’s one of the best tools for developing a more comprehensive understanding of how your organization operates. This is a crucial component in developing product teams that can concentrate on value creation rather than just feature delivery.

Additionally, they serve as a communication artifact that will aid in creating alignment among your stakeholders.

Finally, if you want to learn more finance tools and techniques, you can take my course.