
KPIs provide valuable data that can be analyzed to make informed decisions about resource allocation, strategy adjustments, and other critical aspects of business management. Learning how to use the key performance indicators (KPIs) is essential for any organization aiming to improve its operational efficiency and fulfill its strategic goals.
Top 20 KPIs
Here is the list of the top 20 KPIs every professional should know:
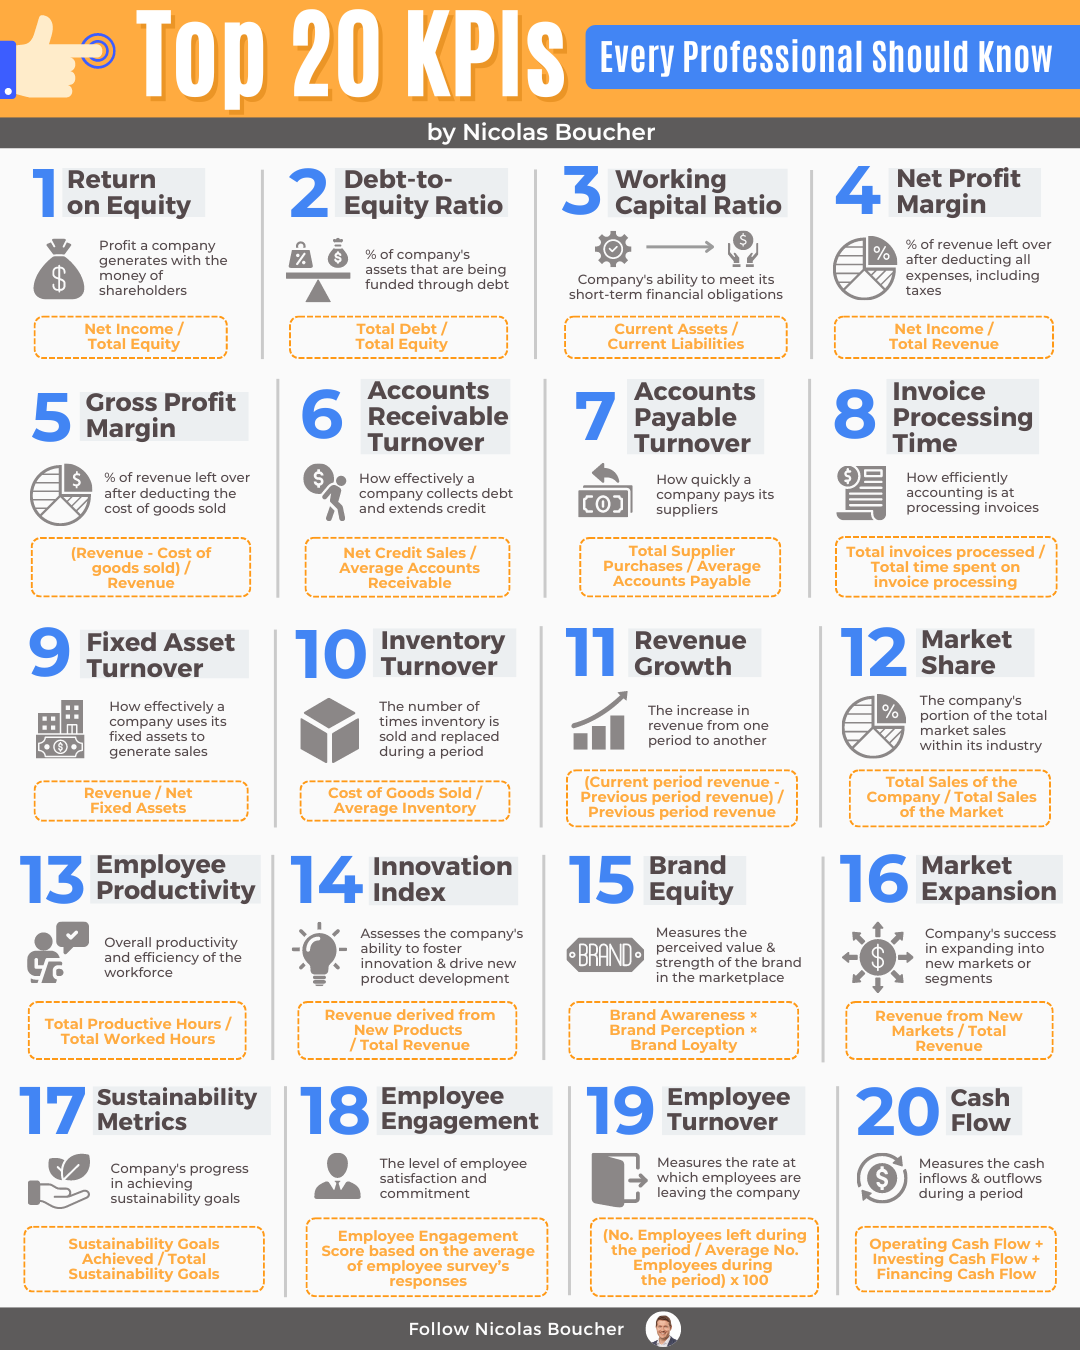
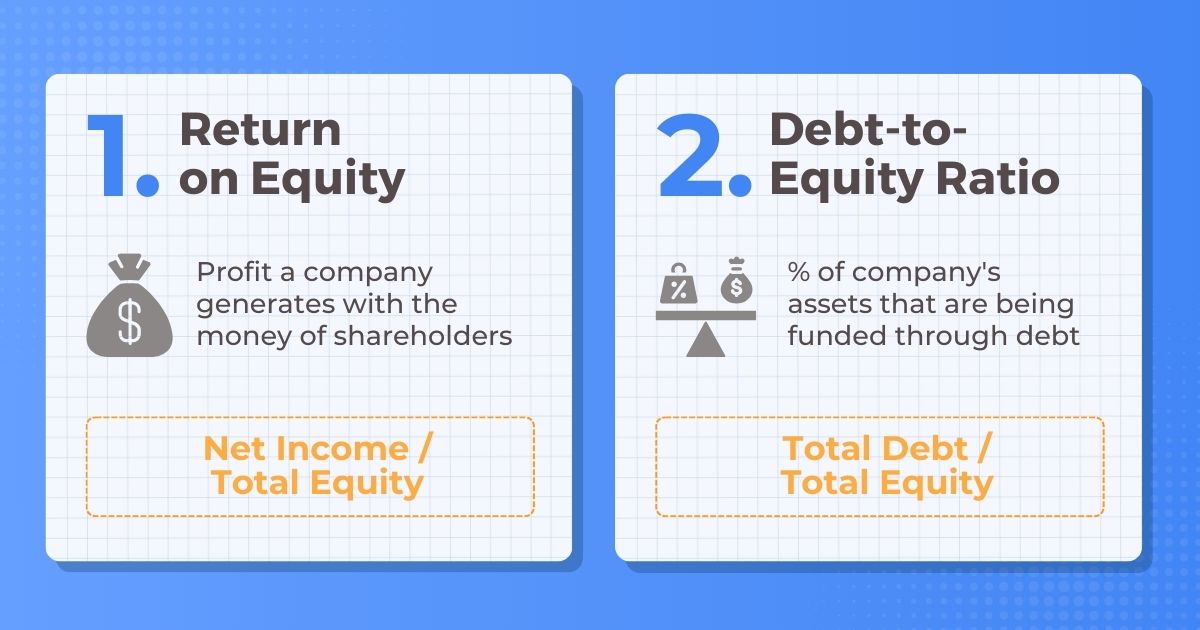
1. Return on Equity
Description: Profit a company generates with the money of shareholders
Formula: Net Income / Total Equity
How to use it: Analyze the financial efficiency and profitability relative to shareholders’ equity
Why you need to use it: To assess how effectively a company is using its equity base to generate profits
When you need to use it: Regularly, during financial analysis and reporting periods. But also, in preparation for shareholder meetings or investor presentations and after significant changes in equity structure, such as new equity issuance or buybacks.
2. Debt-to-Equity Ratio
Description: % of the company’s assets that are being funded through debt
Formula: Total Debt / Total Equity
How to use it: Evaluate the financial leverage and risk of a company
Why you need to use it: To understand the balance between debt and equity financing
When you need to use it: During financial health assessments and risk management reviews. Also, in response to changes in interest rates or credit markets.
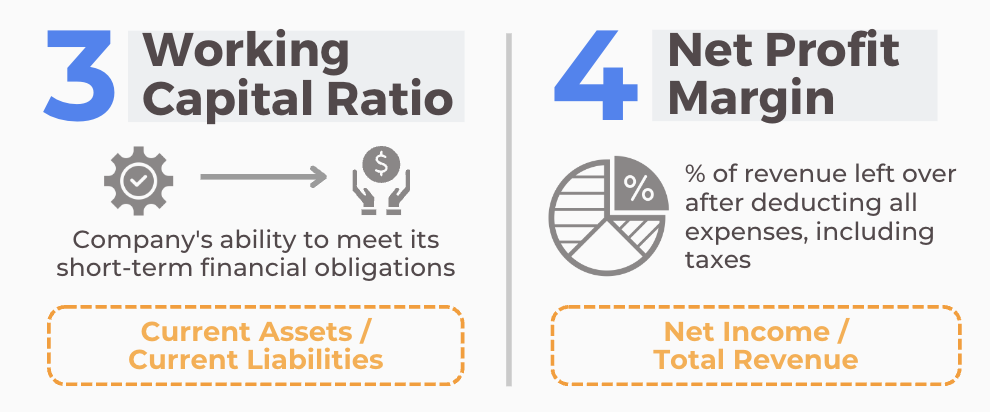
3. Working Capital Ratio
Description: The company’s ability to meet its short-term financial obligations
Formula: Current Assets / Current Liabilities
How to use it: Determine the liquidity and short-term operational efficiency
Why you need to use it: To ensure the company can cover its short-term liabilities with its short-term assets
When you need to use it: Regularly, especially before making significant financial decisions. Additionally, in response to changes in market conditions affecting liquidity or when planning for expansion or capital investments.
4. Net Profit Margin
Description: % of revenue left over after deducting all expenses, including taxes
Formula: Net Income / Total Revenue
How to use it: Measure overall profitability
Why you need to use it: To understand how much profit is generated from total revenue
When you need to use it: During financial performance reviews and strategic planning or after implementing cost-saving measures to assess their impact on profitability.
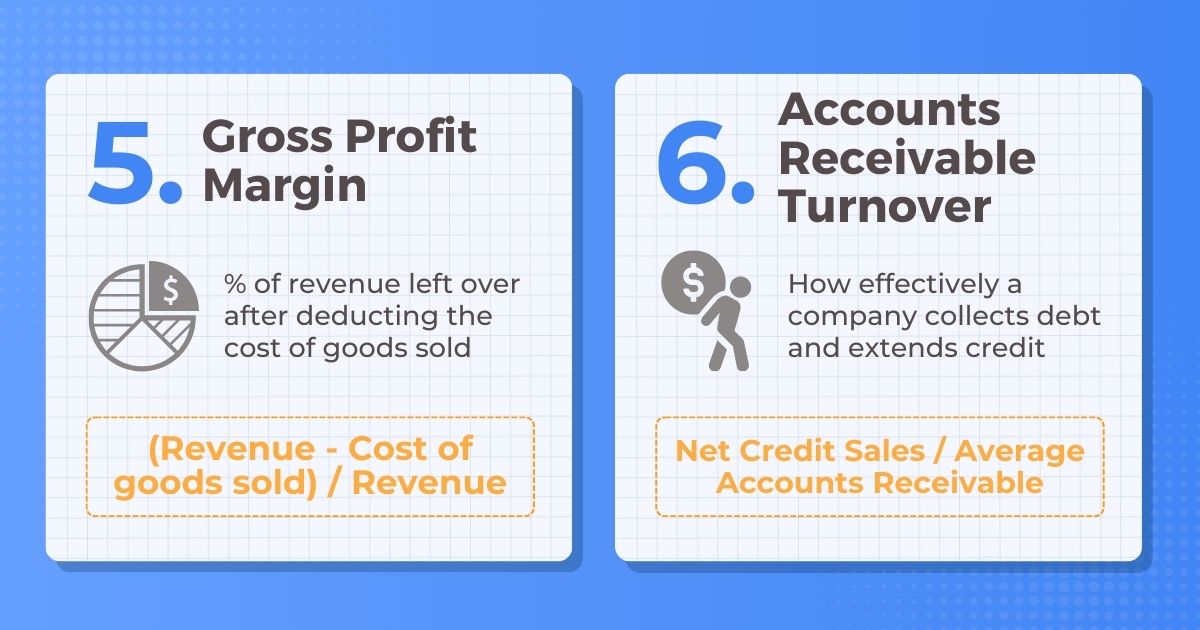
5. Gross Profit Margin
Description: % of revenue left over after deducting the cost of goods sold
Formula: (Revenue – Cost of goods sold) / Revenue
How to use it: Evaluate the efficiency of production and pricing strategies
Why you need to use it: To measure how well a company is managing its production costs relative to revenue
When you need to use it: Regularly, especially after changes in production costs or pricing strategies
6. AR Turnover
Description: How effectively a company collects debt and extends credit
Formula: Net Credit Sales / Average Accounts Receivable
How to use it: Assess the efficiency of credit policies and collections
Why you need to use it: To improve cash flow management by evaluating how quickly receivables are collected
When you need to use it: Periodically to ensure credit policies are effective
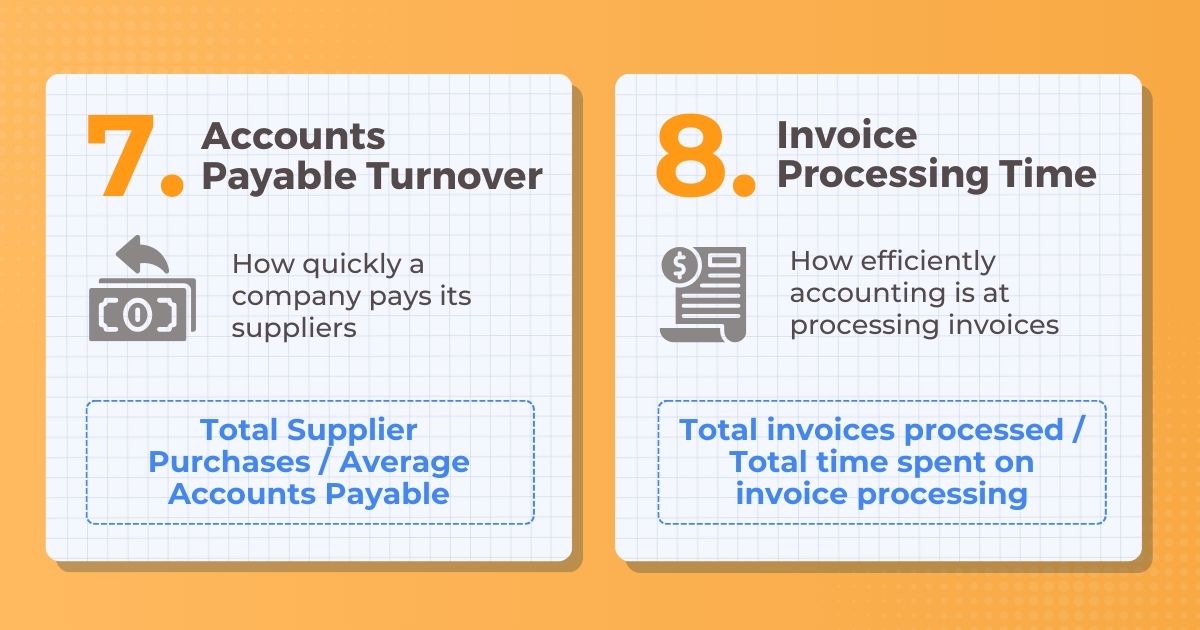
7. AP Turnover
Description: How quickly a company pays its suppliers
Formula: Total Supplier Purchases / Average Accounts Payable
How to use it: Evaluate payment efficiency and supplier relationships
Why you need to use it: To ensure timely payments and maintain good supplier relations
When you need to use it: Regularly, especially in cash flow analysis
8. Invoice Processing Time
Description: How efficiently accounting is at processing invoices
Formula: Total invoices processed / Total time spent on invoice processing
How to use it: Measure the efficiency of the invoicing process
Why you need to use it: To improve operational efficiency and reduce processing costs
When you need to use it:When you need to give a target to your Accounts Payable team and monitor their performance
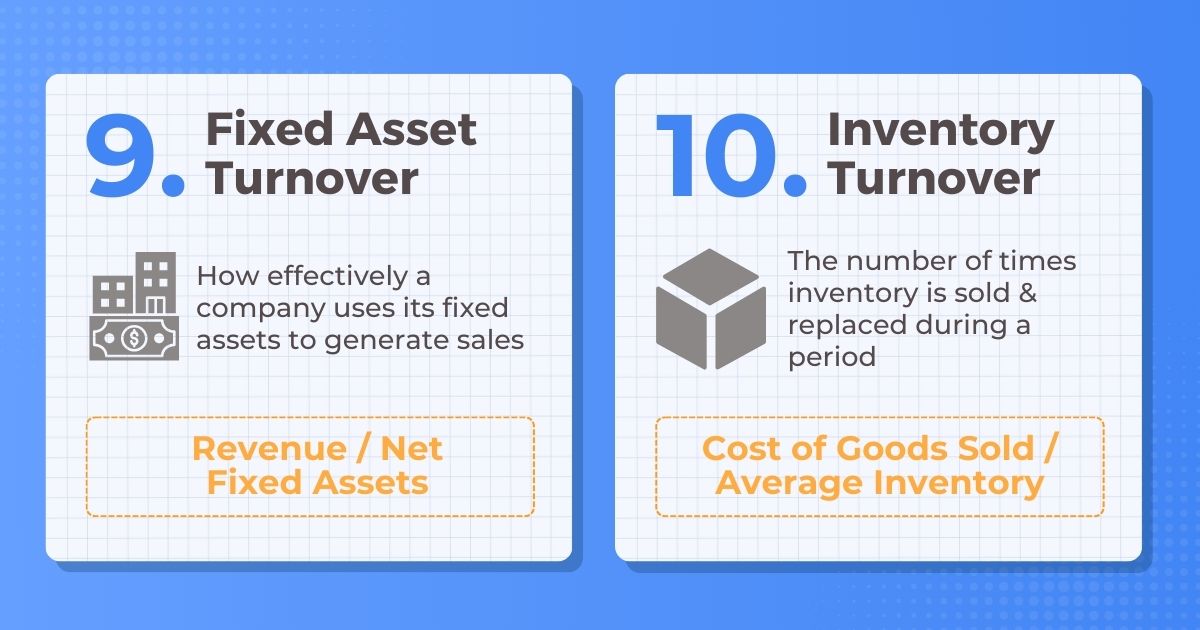
9. Fixed Asset Turnover
Description: How effectively a company uses its fixed assets to generate sales
Formula: Revenue / Net Fixed Assets
How to use it: Assess the productivity of fixed assets
Why you need to use it: To understand how well the company’s investments in fixed assets are generating revenue
When you need to use it: Regularly, particularly during capital budgeting
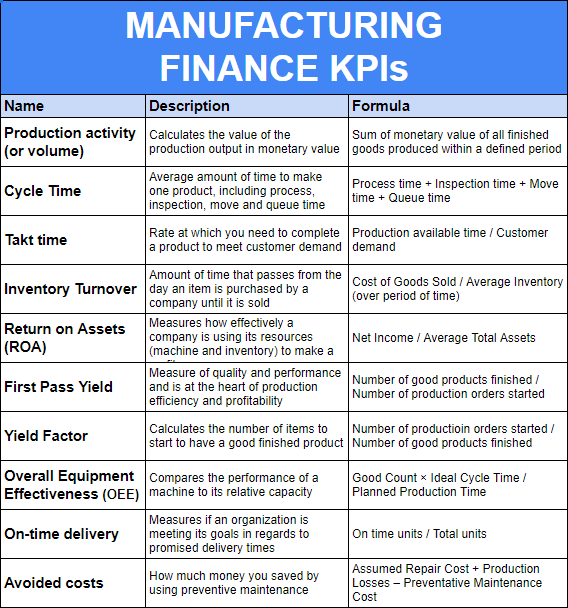
10. Inventory Turnover
Description: The number of times inventory is sold and replaced during a period
Formula: Cost of Goods Sold / Average Inventory
How to use it: Measure the efficiency of inventory management
Why you need to use it: To optimize inventory levels and reduce holding costs
When you need to use it:Review it at least quarterly or when you see your cash flow being tight and you are looking for ways to improve your liquidities
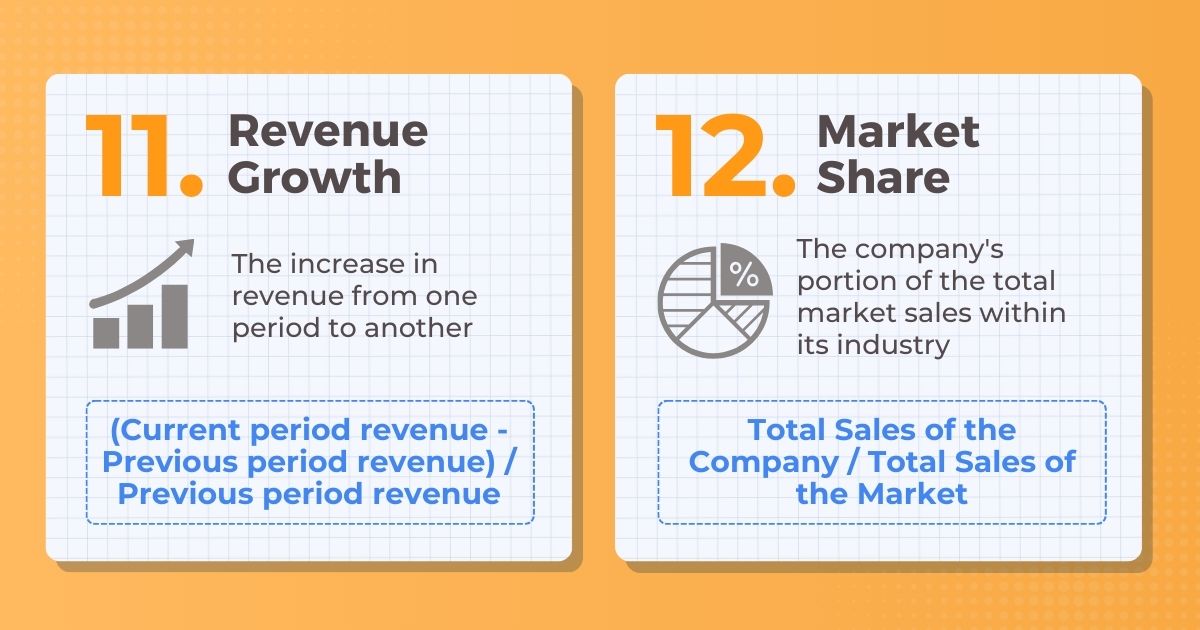
11. Revenue Growth
Description: The increase in revenue from one period to another
Formula: (Current period revenue – Previous period revenue) / Previous period revenue
How to use it: Track and evaluate business growth
Why you need to use it: To understand the effectiveness of sales and marketing strategies
When you need to use it: Regularly, especially during strategic planning sessions. After launching new products or services to measure their impact on revenue and in response to changes in market conditions to evaluate resilience and adaptability.
12. Market Share
Description: The company’s portion of the total market sales within its industry
Formula: Total Sales of the Company / Total Sales of the Market
How to use it: Assess competitive position in the market
Why you need to use it: To gauge the effectiveness of market penetration strategies
When you need to use it: Regularly, particularly after marketing campaigns. Also, when evaluating the effectiveness of sponsorships, partnerships, and endorsements.
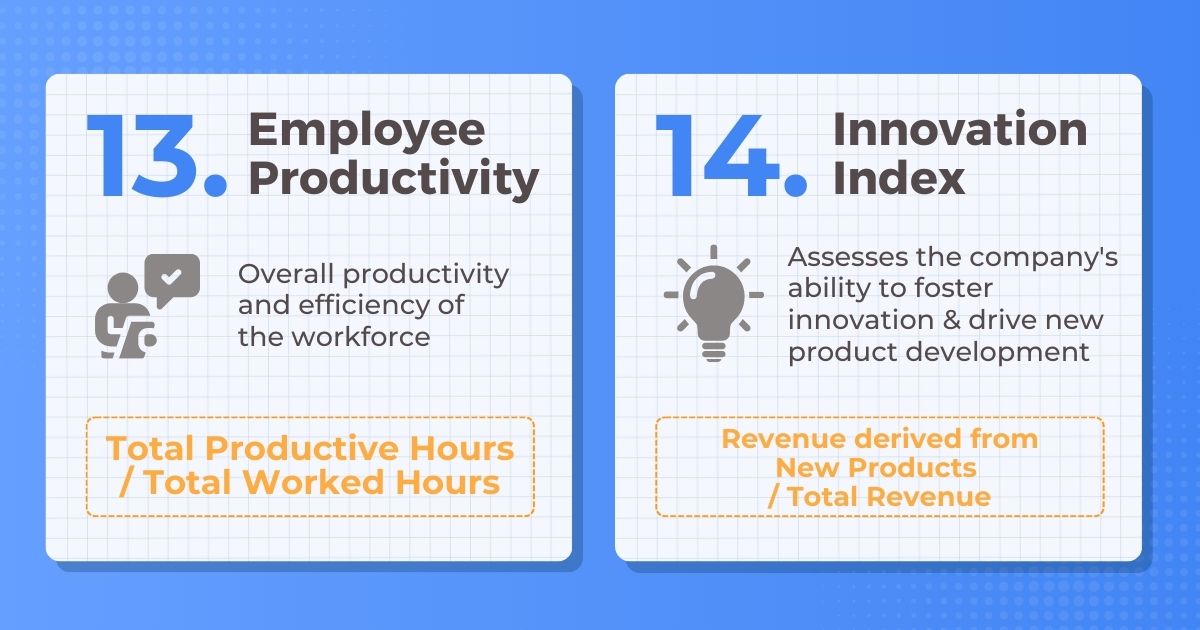
13. Employee Productivity
Description: Overall productivity and efficiency of the workforce
Formula: Total Productive Hours / Total Worked Hours
How to use it: Measure the efficiency of labor
Why you need to use it: To identify areas for improvement and boost productivity
When you need to use it: Continuously monitor and improve workforce efficiency, especially in response to significant changes in workforce structure, such as restructuring, hiring, or layoffs. Moreover, when planning training programs to identify areas needing development and after implementing new processes or tools to measure their impact on productivity.
14. Innovation Index
Description: Assesses the company’s ability to foster innovation & drive new product development
Formula: Revenue derived from New Products/ Total Revenue
How to use it: Evaluate the impact of new products on revenue
Why you need to use it: To measure the effectiveness of innovation efforts
When you need to use it: Regularly, particularly after new product launches and major R&D investments.
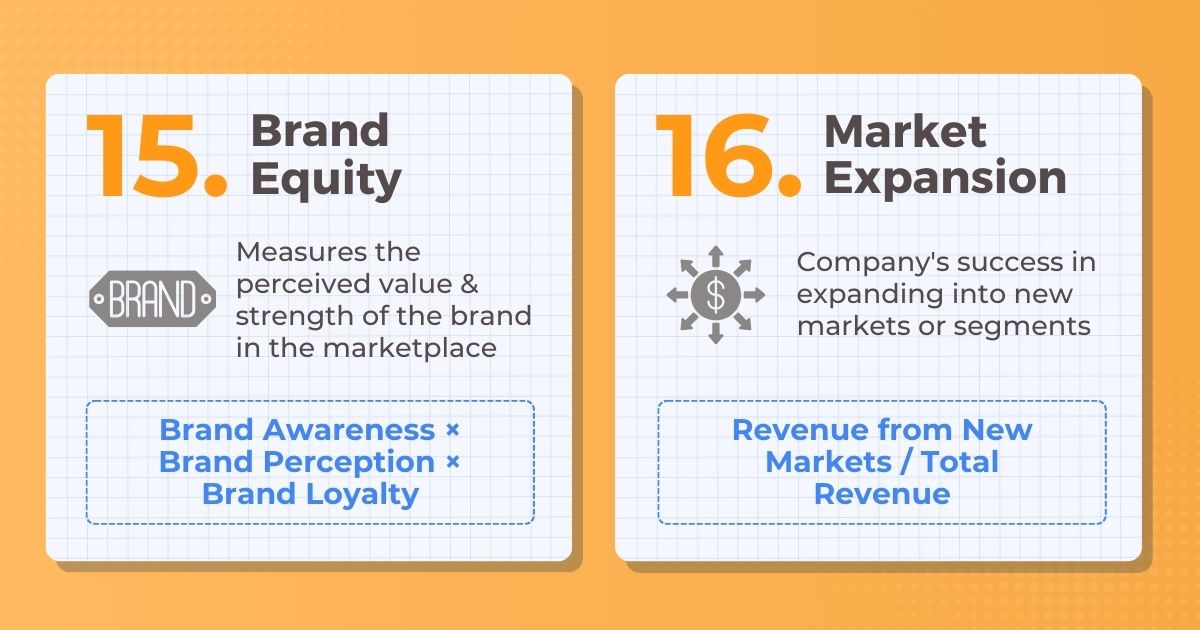
15. Brand Equity
Description: Measures the perceived value & strength of the brand in the marketplace
Formula: Brand Awareness × Brand Perception × Brand Loyalty
How to use it: Assess the strength and value of the brand
Why you need to use it: To understand the impact of branding efforts and customer loyalty
When you need to use it: Periodically, especially after marketing campaigns. Also, when evaluating the effectiveness of sponsorships, partnerships, and endorsements.
16. Market Expansion
Description: The Company’s success in expanding into new markets or segments
Formula: Revenue from New Markets / Total Revenue
How to use it: Evaluate the effectiveness of market expansion strategies
Why you need to use it: To measure growth and identify successful market entries
When you need to use it: During strategic planning to assess and refine expansion strategies or to compare performance across different markets and regions.
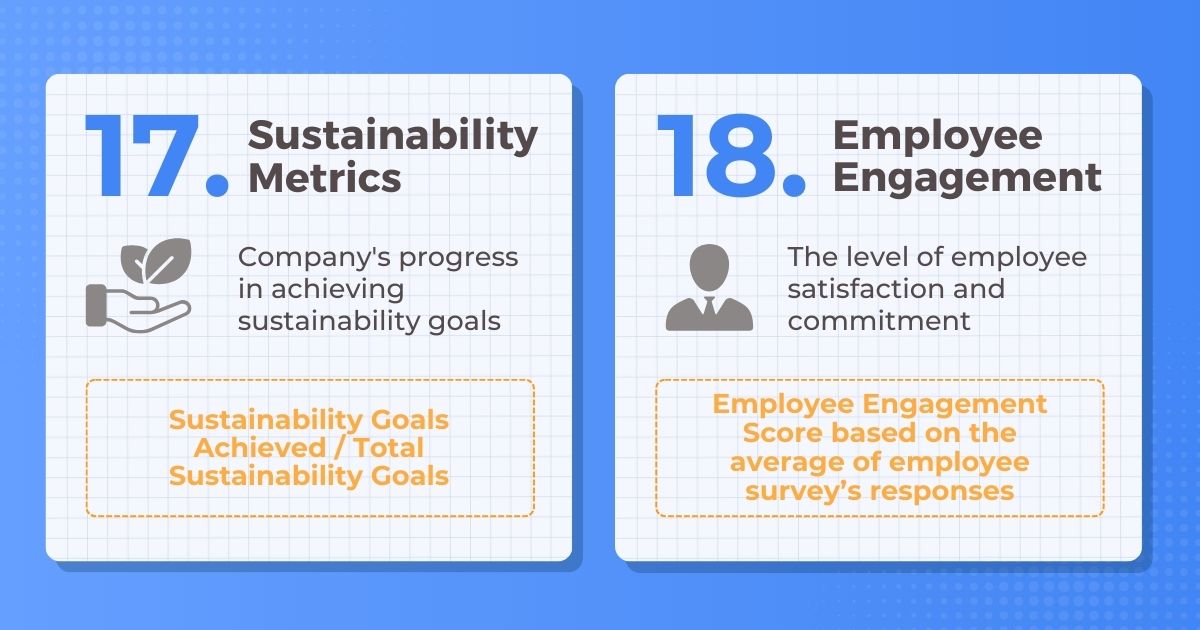
17. Sustainability Metrics
Description: Company’s progress in achieving sustainability goals
Formula: Sustainability Goals Achieved / Total Sustainability Goals
How to use it: Measure progress toward sustainability initiatives
Why you need to use it: To track environmental impact and corporate social responsibility efforts
When you need to use it: Continuously to ensure alignment with sustainability objectives, during sustainability reporting periods to communicate progress to stakeholders and in response to regulatory requirements and compliance checks.
18. Employee Engagement
Description: The level of employee satisfaction and commitment
Formula: Employee Engagement Score based on the average of employee survey responses
How to use it: Assess employee satisfaction and engagement
Why you need to use it: To improve workplace culture and retention rates
When you need to use it: Regularly, typically through annual or bi-annual surveys, but also when developing employee development and retention programs.
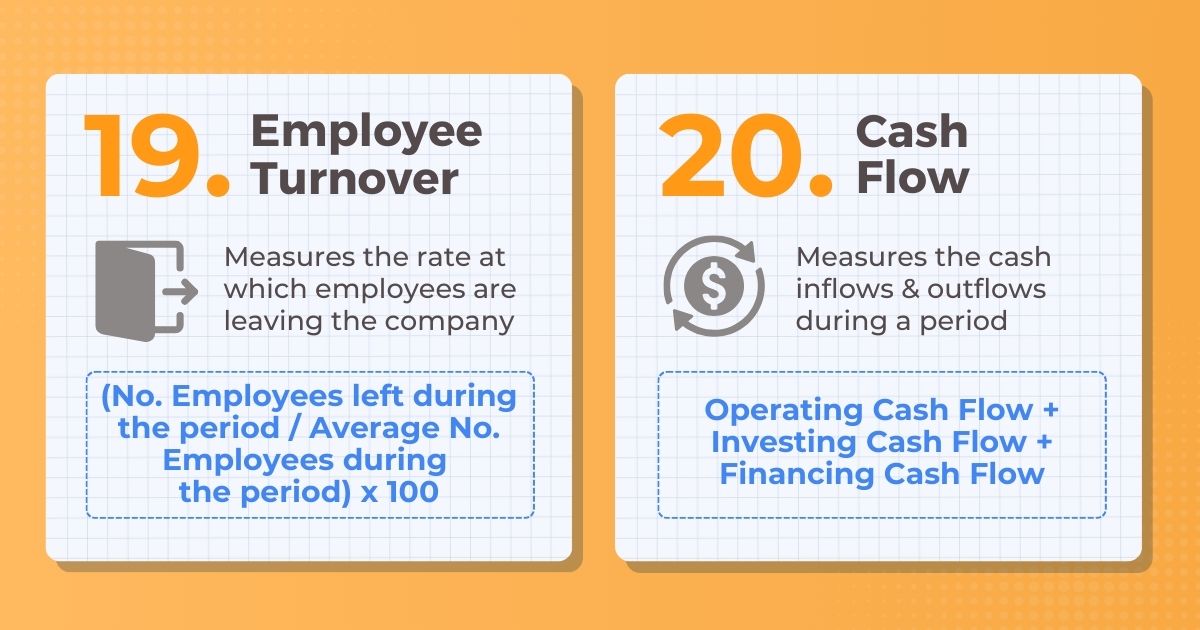
19. Employee Turnover
Description: Measures the rate at which employees are leaving the company
Formula: # Employees left during the period / Average # Employees during
How to use it: Monitor workforce stability and retention
Why you need to use it: To identify and address issues related to employee satisfaction and retention
When you need to use it: Continuously, especially after significant organizational changes and closely after implementing new policies or changes affecting employees.
20. Cash Flow
Description: Measures the cash inflows & outflows during a period
Formula: Operating Cash Flow + Investing Cash Flow + Financing Cash Flow
How to use it: Evaluate liquidity and financial health
Why you need to use it: To ensure the company has sufficient cash to meet its obligations
When you need to use it: Continuously to manage cash flow effectively and make informed financial decisions. Also, during financial reporting periods to assess the company’s cash position and when preparing budgets and financial forecasts.
Bonus
Get my extended version of the Top 100 KPIs packed in a Cheat Sheet for free here.
KPIs vs. OKRs
KPIs and OKRs are the most essential metrics for tracking your performance and realizing your goals.
But what are their differences?
Here are the main differences:
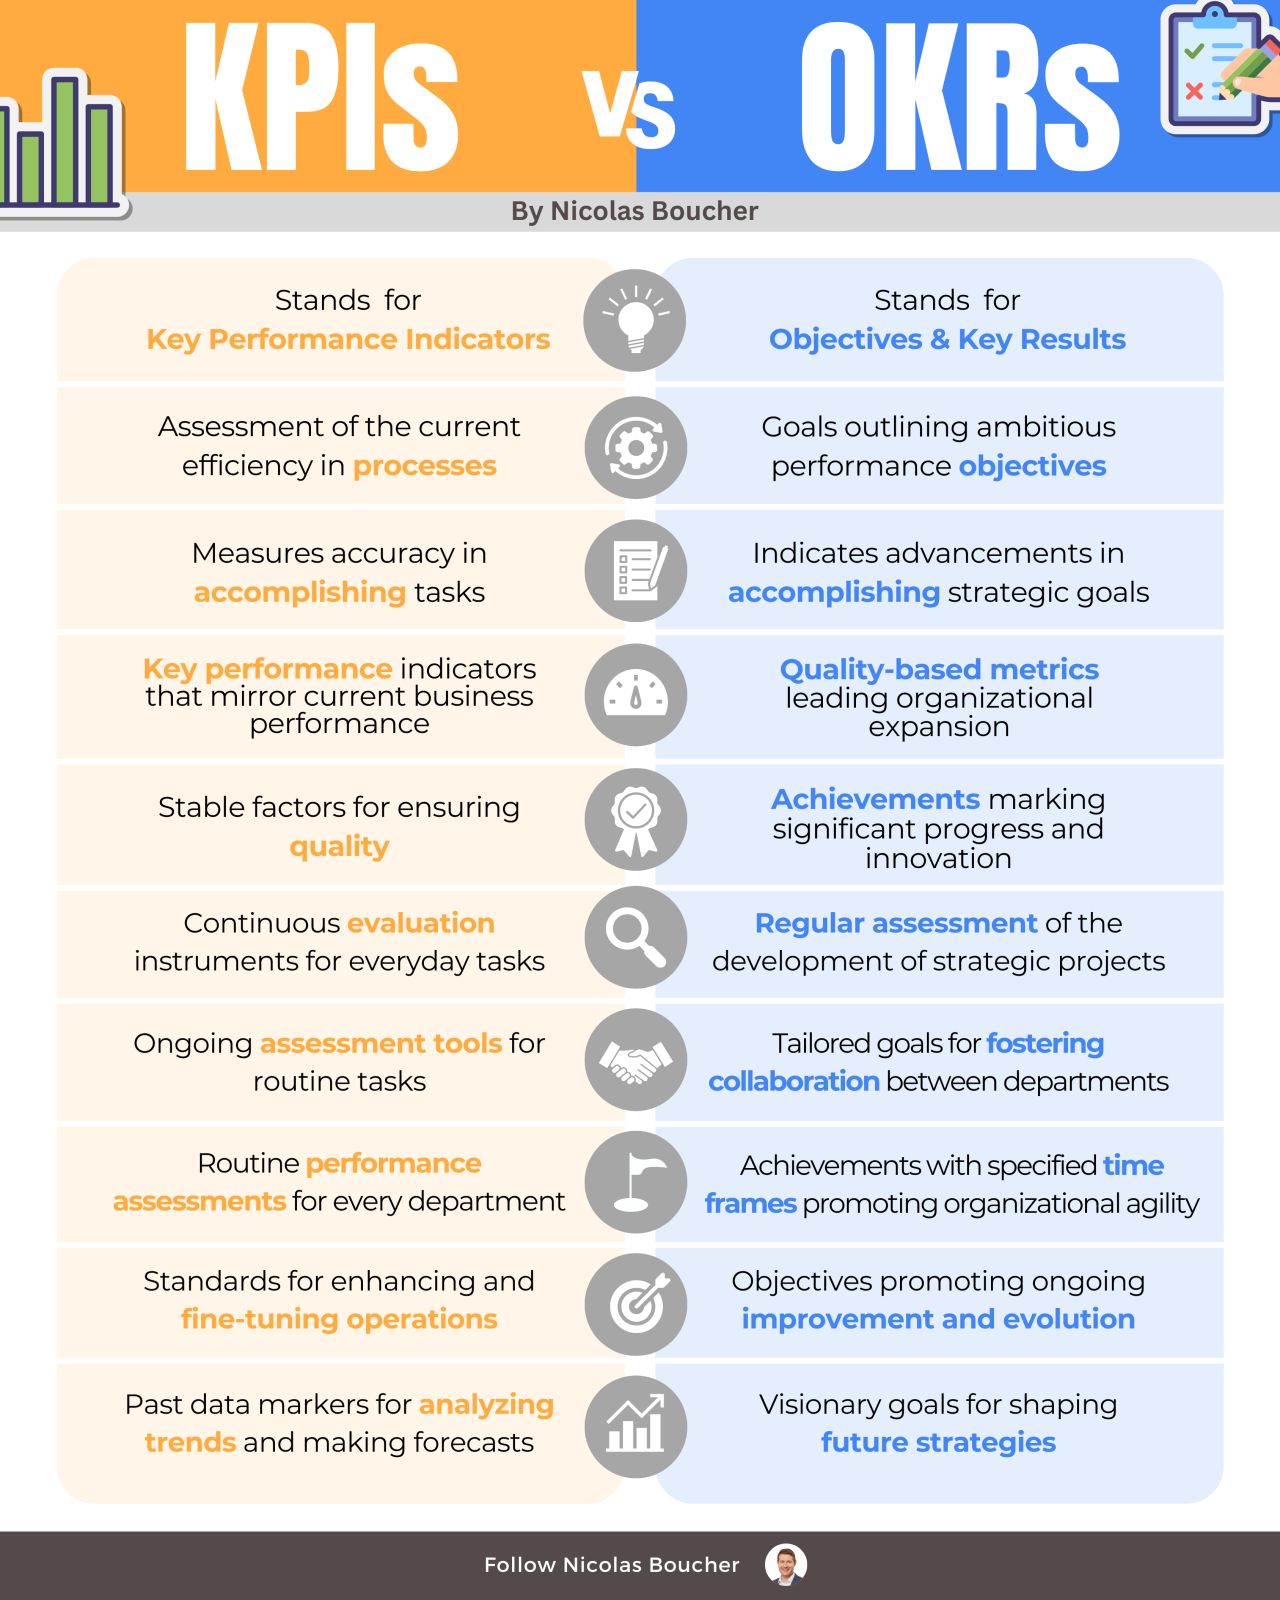
Key Performance Indicators (KPIs)
1. Tracks precision in task completion
2. Benchmarks for current process efficiency
3. Indicators of stable operational capacity
4. Metrics reflecting real-time business performance
5. Consistent variables for quality assurance
6. Ongoing assessment tools for routine activities
7. Standardized measures for departmental comparison
8. Regular performance checkpoints for all divisions
9. Criteria for operational improvement and refinement
10. Historical data points for trend analysis and forecasting
Objectives and Key Results (OKRs)
1. Marks progress in strategic goal achievement
2. Objectives defining ambitious performance targets
3. Catalysts for driving forward-thinking initiatives
4. Qualitative measures guiding organizational growth
5. Milestones for breakthrough progress and innovation
6. Periodic evaluation of strategic project development
7. Custom objectives for inter-departmental synergy
8. Time-bound achievements fostering organizational agility
9. Goals that encourage continual refinement and evolution
10. Forward-looking targets for shaping future strategies
How are they connected?
Here is an example:
KPI (Key Performance Indicator)
Example: Number of Qualified Leads Generated
- What it measures: The effectiveness of the lead generation efforts in attracting potential customers who are likely to convert.
- How it’s used: By tracking the number of qualified leads generated, the finance team can assess the success of marketing campaigns and initiatives to drive customer acquisition.
OKR (Objectives and Key Results)
Objective: Increase Revenue by 20%.
- Key Result 1: Generate 500 qualified leads per month, contributing to a 15% increase in customer acquisition.
- Key Result 2: Convert 20% of qualified leads into paying customers through targeted sales efforts, contributing to revenue growth.
- Key Result 3: Implement a lead scoring system to improve lead quality and increase conversion rates by 10%.
The connection
- The KPI on lead generation (Number of Qualified Leads Generated) aligns with the OKR’s Key Results, particularly in generating qualified leads (Key Result 1) and converting them into customers (Key Result 2)
- Together, the KPI and OKR ensure that the finance team tracks both the quantity and quality of leads generated, contributing to the overarching goal of revenue growth outlined in the OKR.
The Bottom Line
Incorporating Key Performance Indicators (KPIs) is a game-changer for any organization striving to enhance its performance and achieve strategic goals. These essential metrics clearly show your business’s financial health, operational efficiency, and overall effectiveness. With the top 20 KPIs I outlined today, you can gain critical insights, drive informed decision-making, and foster a culture of continuous improvement.
Leveraging these KPIs will empower you to optimize resource allocation, identify growth opportunities, and stay ahead of your competition.
FAQ Section
Q: What are Key Performance Indicators (KPIs)?
A: KPIs are measurable values that help organizations track their progress toward achieving specific goals. They provide insights into various aspects of business performance, allowing for data-driven decision-making and strategic adjustments.
Q: How do KPIs differ from Objectives and Key Results (OKRs)?
A: KPIs focus on tracking the efficiency and effectiveness of ongoing operations through specific metrics, while OKRs are goal-setting frameworks that define ambitious objectives and the key results needed to achieve them. KPIs provide real-time performance data, whereas OKRs drive strategic growth and innovation.
Q: Why are KPIs important for businesses?
A: KPIs are crucial because they provide actionable insights into business performance, helping organizations identify areas for improvement, optimize resource allocation, and make informed strategic decisions. Monitoring your KPIs will help you stay on track to meet your goals and maintain a competitive edge.
Q: How can I choose the right KPIs for my business?
Choosing the right KPIs involves understanding your business objectives and identifying the metrics that directly impact those goals. Consider factors such as financial performance, operational efficiency, customer satisfaction, and employee engagement. The selected KPIs should be relevant, measurable, and aligned with your strategic priorities.
Q: Can KPIs change over time?
Yes, KPIs can and should change over time as business goals evolve and market conditions shift. Regularly reviewing and updating your KPIs ensures they remain relevant and effective in measuring the success of your current strategies and initiatives. Staying agile and adjusting your KPIs to reflect new priorities and challenges is important.