

A KPI, or key performance indicator, is a measurable metric that aids businesses in determining how successfully they accomplish their strategic goals and growth objectives. In addition, the KPIs in finance and FP&A may assist a company in setting goals, assessing performance, identifying organizational strengths, and ultimately determining the success of the company as a whole.
Also, you can better position yourself to evaluate how the firm is doing financially by studying these data. Then, you may make adjustments to your department’s or team’s goals in order to support important strategic goals.
Table of Contents
KPIs in Finance and FP&A – SaaS KPIs
Your company’s performance is measured by its SaaS KPIs, and most entrepreneurs are aware that some metrics are more important than others.
As a result, in order for you to not have to worry about missing out on any of the most crucial ones when you are ready to finish your SaaS business plan, I have created a table of the 10 most significant SaaS KPIs.
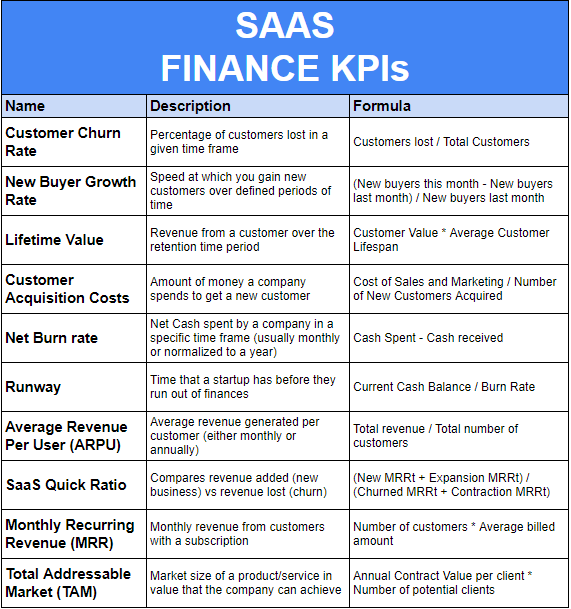
#1: KPIs in Finance and FP&A – Customer Churn Rate
- Description: Percentage of customers lost in a given time frame
- Formula: Customers lost / Total Customers
#2: New Buyer Growth Rate
- Description: Speed at which you gain new customers over defined periods of time
- Formula: (New buyers this month – New buyers last month) / New buyers last month
#3: KPIs in Finance and FP&A – Lifetime Value
- Description: Revenue from a customer over the retention time period
- Formula: Customer Value * Average Customer Lifespan
#4: Customer Acquisition Costs
- Description: Amount of money a company spends to get a new customer
- Formula: Cost of Sales and Marketing / Number of New Customers Acquired
#5: Net Burn rate
- Description: Net Cash spent by a company in a specific time frame (usually monthly or normalized to a year)
- Formula: Cash Spent – Cash received
#6: Runway
- Description: Time that a startup has before they run out of finances
- Formula: Current Cash Balance / Burn Rate
#7: Average Revenue Per User (ARPU)
- Description: Average revenue generated per customer (either monthly or annually)
- Formula: Total revenue / Total number of customers
#8: SaaS Quick Ratio
- Description: Compares revenue added (new business) vs revenue lost (churn)
- Formula: (New MRRt + Expansion MRRt) / (Churned MRRt + Contraction MRRt)
#9: Monthly Recurring Revenue (MRR)
- Description: Monthly revenue from customers with a subscription
- Formula: Number of customers * Average billed amount
#10: KPIs in Finance and FP&A – Total Addressable Market (TAM)
- Description: Market size of a product/service in value that the company can achieve
- Formula: Annual Contract Value per client * Number of potential clients
KPIs in Finance and FP&A – Manufacturing KPIs
The Manufacturing KPI is a clearly defined measure used to track, evaluate, and improve production processes in terms of quantity, quality, and other cost factors.
In other words, they provide manufacturers with priceless business insights that help them achieve their objectives. Ultimately, here is the table of the top 10 Manufacturing KPIs.
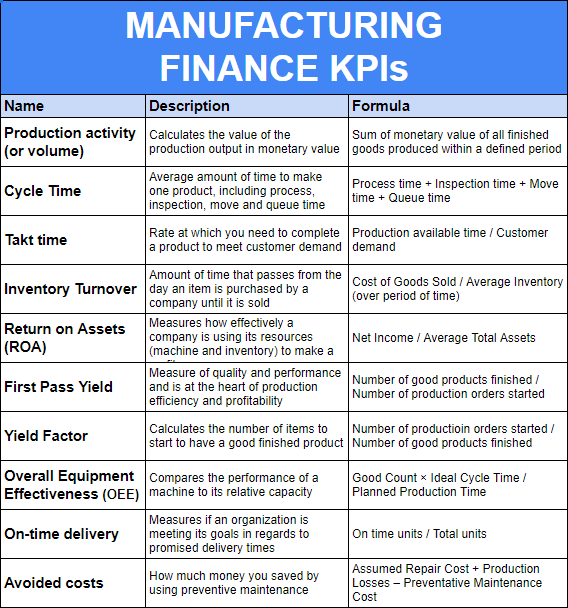
#1: KPIs in Finance and FP&A – Production Activity (or Volume)
- Description: Calculates the value of the production output in monetary value
- Formula: Sum of the monetary value of all finished goods produced within a defined period
#2: Cycle Time
- Description: Average amount of time to make one product, including process, inspection, move, and queue time
- Formula: Process time + Inspection time + Move time + Queue time
#3: Takt Time
- Description: Rate at which you need to complete a product to meet customer demand
- Formula: Production available time / Customer demand
#4: Inventory Turnover
- Description: Amount of time that passes from the day an item is purchased by a company until it is sold
- Formula: Cost of Goods Sold / Average Inventory (over a period of time)
#5: Return on Assets (ROA)
- Description: Measures how effectively a company is using its resources (machine and inventory) to make a profit
- Formula: Net Income / Average Total Assets
#6: First Pass Yield
- Description: Measure of quality and performance and is at the heart of production efficiency and profitability
- Formula: Number of good products finished / Number of production orders started
#7: Yield Factor
- Description: Calculates the number of items to start to have a good finished product
- Formula: Number of production orders started / Number of good products finished
#8: Overall Equipment Effectiveness (OEE)
- Description: Compares the performance of a machine to its relative capacity
- Formula: Good Count × Ideal Cycle Time / Planned Production Time
#9: On-Time Delivery
- Description: Measures if an organization is meeting its goals in regard to promised delivery times
- Formula: On-time units / Total units
#10: KPIs in Finance and FP&A – Avoided Costs
- Description: How much money you saved by using preventive maintenance
- Formula: Assumed Repair Cost + Production Losses – Preventative Maintenance Cost
KPIs in Finance and FP&A – Cash KPIs
The greatest cash flow indicators and Cash KPIs provide information about the financial health and potential of your organization. Additionally, some of these measures may be calculated by investors using data from financial statements.
As a result, investors can better comprehend a company’s finances thanks to many of these data. To clarify, here is the table of the top 10 Cash KPIs.
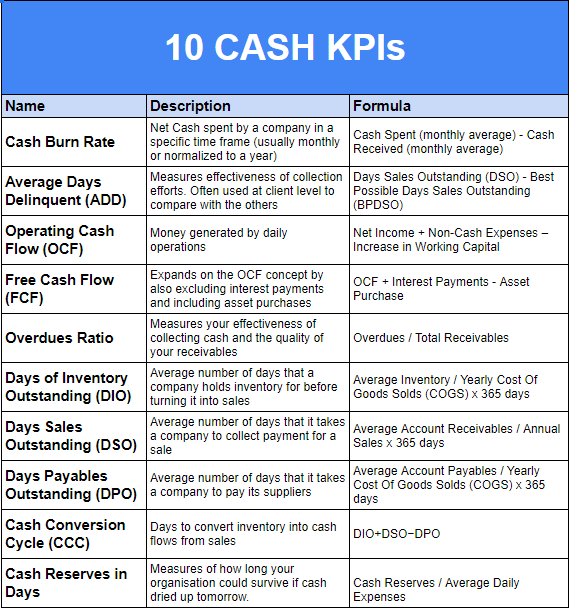
#1: KPIs in Finance and FP&A – Cash Burn Rate
- Description: Net Cash spent by a company in a specific time frame (usually monthly or normalized to a year)
- Formula: Cash Spent (monthly average) – Cash Received (monthly average)
#2: Average Days Delinquent (ADD)
- Description: Measures effectiveness of collection efforts. Often used at the client level to compare with the others
- Formula: Days Sales Outstanding (DSO) – Best Possible Days Sales Outstanding (BPDSO)
#3: Operating Cash Flow (OCF)
- Description: Money generated by daily operations
- Formula: Net Income + Non-Cash Expenses – Increase in Working Capital
#4: Free Cash Flow (FCF)
- Description: Expands on the OCF concept by also excluding interest payments and including asset purchases
- Formula: OCF + Interest Payments – Asset Purchase
#5: Overdues Ratio
- Description: Measures your effectiveness of collecting cash and the quality of your receivables
- Formula: Overdues / Total Receivables
#6: Days of Inventory Outstanding (DIO)
- Description: Average number of days that a company holds inventory before turning it into sales
- Formula: Average Inventory / Yearly Cost Of Goods Sold (COGS) x 365 days
#7: Days Sales Outstanding (DSO)
- Description: Average number of days that it takes a company to collect payment for a sale
- Formula: Average Account Receivables / Annual Sales x 365 days
#8: Days Payables Outstanding (DPO)
- Description: Average number of days that it takes a company to pay its suppliers
- Formula: Average Account Payables / Yearly Cost Of Goods Sold (COGS) x 365 days
#9: Cash Conversion Cycle (CCC)
- Description: Days to convert inventory into cash flows from sales
- Formula: DIO+DSO−DPO
#10: KPIs in Finance and FP&A – Cash Reserves in Days
- Description: Measures of how long your organization could survive if cash dried up tomorrow.
- Formula: Cash Reserves / Average Daily Expenses
KPIs in Finance and FP&A – Inventory KPIs
Inventory KPIs can offer profound insights into a wide range of other operational concerns.
In other words, your inventory contains a wealth of important, actionable information, from sales numbers and future demand to storage performance and opportunity costs. Furthermore, here is the table of the top 10 Inventory KPIs.
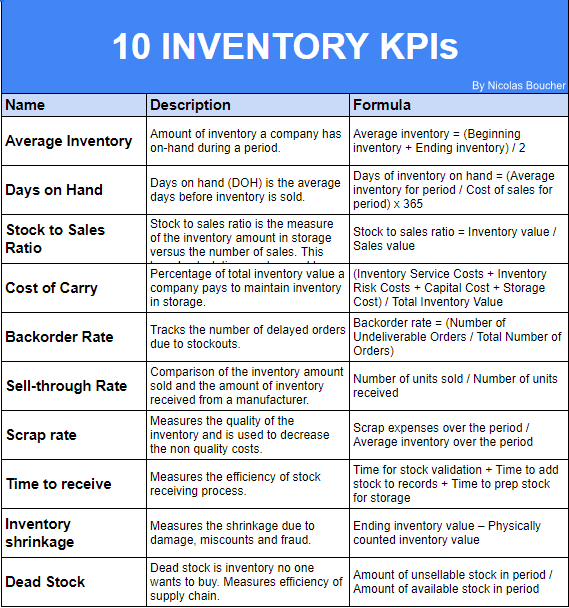
#1: KPIs in Finance and FP&A – Average Inventory
- Description: Amount of inventory a company has on hand during a period.
- Formula: Average inventory = (Beginning inventory + Ending inventory) / 2
#2: Days on Hand
- Description: Days on hand (DOH) is the average days before inventory is sold.
- Formula: Days of inventory on hand = (Average inventory for period / Cost of sales for a period) x 365
#3: Stock-to-Sales Ratio
- Description: Stock-to-sales ratio is the measure of the inventory amount in storage versus the number of sales. This broad calculation can be used to adjust the stock to maintain high margins.
- Formula: Stock to sales ratio = Inventory value / Sales value
#4: Cost of Carry
- Description: Percentage of total inventory value a company pays to maintain inventory in storage.
- Formula: (Inventory Service Costs + Inventory Risk Costs + Capital Cost + Storage Cost) / Total Inventory Value
#5: Backorder Rate
- Description: Tracks the number of delayed orders due to stockouts.
- Formula: Backorder rate = (Number of Undeliverable Orders / Total Number of Orders)
#6: Sell-through Rate
- Description: Comparison of the inventory amount sold and the amount of inventory received from a manufacturer.
- Formula: Number of units sold / Number of units received
#7: Scrap Rate
- Description: Measures the quality of the inventory and is used to decrease the non-quality costs.
- Formula: Scrap expenses over the period / Average inventory over the period
#8: Time to receive
- Description: Measures the efficiency of the stock-receiving process.
- Formula: Time for stock validation + Time to add stock to records + Time to prep stock for storage
#9: Inventory shrinkage
- Description: Measures the shrinkage due to damage, miscounts, and fraud.
- Formula: Ending inventory value – Physically counted inventory value
#10: KPIs in Finance and FP&A – Dead Stock
- Description: Dead stock is inventory no one wants to buy. Measures efficiency of the supply chain.
- Formula: Amount of unsellable stock in period / Amount of available stock in the period
KPIs in Finance and FP&A – Headcount KPIs
The Headcount KPIs provide readers with information on the whole workforce of the firm or department of focus.
Therefore, for the great majority of HR reports, internal management choices, and finances, headcount is a necessary measurement. In addition, here is the table of the top 10 Headcount KPIs.
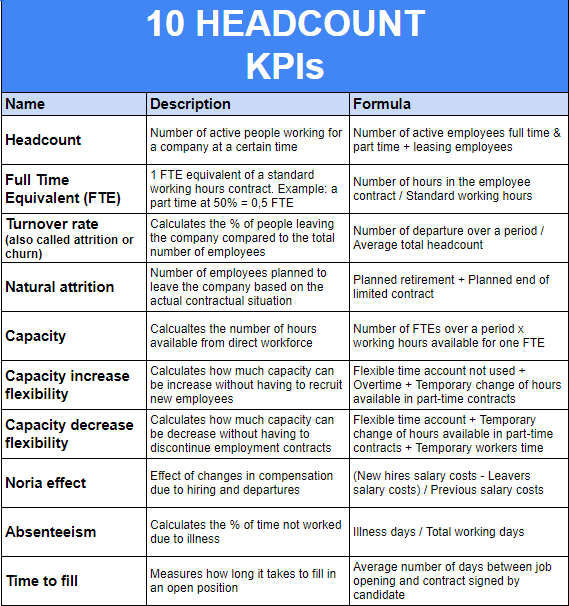
#1: KPIs in Finance and FP&A – Headcount
- Description: Number of active people working for a company at a certain time
- Formula: Number of active employees full-time & part-time + leasing employees
#2: Full-Time Equivalent (FTE)
- Description: 1 FTE equivalent of a standard working hours contract. Example: a part-time at 50% = 0,5 FTE
- Formula: Number of hours in the employee contract / Standard working hours
#3: Turnover Rate (also Called Attrition or Churn)
- Description: Calculates the % of people leaving the company compared to the total number of employees
- Formula: Number of departures over a period / Average total headcount
#4: Natural Attrition
- Description: Number of employees planned to leave the company based on the actual contractual situation
- Formula: Planned retirement + Planned end of limited contract
#5: Capacity
- Description: Calculates the number of hours available from the direct workforce
- Formula: Number of FTEs over a period x working hours available for one FTE
#6: Capacity Increase Flexibility
- Description: Calculates how much capacity can be increased without having to recruit new employees
- Formula: Flexible time account not used + Overtime + Temporary change of hours available in part-time contracts
#7: Capacity Decrease Flexibility
- Description: Calculates how much capacity can be decreased without having to discontinue employment contracts
- Formula: Flexible time account + Temporary change of hours available in part-time contracts + Temporary worker’s time
#8: Noria Effect
- Description: Effect of changes in compensation due to hiring and departures
- Formula: (New hires salary costs – Leavers salary costs) / Previous salary costs
#9: Absenteeism
- Description: Calculates the % of the time not worked due to illness
- Formula: Illness days / Total working days
#10: KPIs in Finance and FP&A – Time to Fill
- Description: Measures how long it takes to fill in an open position
- Formula: Average number of days between job opening and contract signed by the candidate
The Bottom Line – Understanding and Using The KPIs in Finance and FP&A Are Key to Your Success!
In conclusion, you may track and analyze a wide range of other KPIs in finance and FP&A to see how your business is doing and how your activities affect the development of common objectives.
However, the financial KPIs described above are an excellent place to start. Therefore, all finance professionals must gain a strong understanding of how these measures affect business strategy and the company as a whole.
Finally, you can take my course for finance professionals to learn all you need to become an expert in finance with valuable knowledge.
Key Takeaways
- KPIs in Finance and FP&A: Key Performance Indicators (KPIs) in finance and FP&A are measurable metrics used to evaluate a company’s success in achieving strategic goals and growth objectives.
- SaaS KPIs: Essential SaaS KPIs include Customer Churn Rate, New Buyer Growth Rate, Lifetime Value, Customer Acquisition Costs, Net Burn Rate, Runway, ARPU, SaaS Quick Ratio, MRR, and Total Addressable Market.
- Manufacturing KPIs: Critical Manufacturing KPIs encompass Production Activity, Cycle Time, Takt Time, Inventory Turnover, ROA, First Pass Yield, Yield Factor, OEE, On-Time Delivery, and Avoided Costs.
- Cash KPIs: Cash KPIs cover Cash Burn Rate, Average Days Delinquent, OCF, FCF, Overdues Ratio, DIO, DSO, DPO, CCC, and Cash Reserves in Days.
- Inventory KPIs: Inventory KPIs include Average Inventory, Days on Hand, Stock-to-Sales Ratio, Cost of Carry, Backorder Rate, Sell-through Rate, Scrap Rate, Time to receive, Inventory shrinkage, and Dead Stock.
- Headcount KPIs: Headcount KPIs comprise Headcount, Full-Time Equivalent (FTE), Turnover Rate, Natural Attrition, Capacity, Capacity Increase Flexibility, Capacity Decrease Flexibility, Noria Effect, Absenteeism, and Time to Fill.
FAQ
1. What are the KPIs in finance and FP&A?
- KPIs are measurable metrics used to assess how effectively a company achieves its strategic goals and growth objectives, aiding in performance evaluation and goal-setting.
2. How do CEOs and CFOs differ in their roles?
- CEOs focus on strategy and innovation, while CFOs manage financial stability and reporting.
3. What are some essential SaaS KPIs?
- Important SaaS KPIs include Customer Churn Rate, New Buyer Growth Rate, Lifetime Value, Customer Acquisition Costs, Net Burn Rate, Runway, ARPU, SaaS Quick Ratio, MRR, and Total Addressable Market.
4. What Manufacturing KPIs are crucial?
- Vital Manufacturing KPIs encompass Production Activity, Cycle Time, Takt Time, Inventory Turnover, ROA, First Pass Yield, Yield Factor, OEE, On-Time Delivery, and Avoided Costs.
5. What Cash KPIs should be considered?
- Essential Cash KPIs cover Cash Burn Rate, Average Days Delinquent, OCF, FCF, Overdues Ratio, DIO, DSO, DPO, CCC, and Cash Reserves in Days.
6. What Inventory KPIs offer insights?
- Inventory KPIs include Average Inventory, Days on Hand, Stock-to-Sales Ratio, Cost of Carry, Backorder Rate, Sell-through Rate, Scrap Rate, Time to receive, Inventory shrinkage, and Dead Stock.
7. What are Headcount KPIs used for?
- Headcount KPIs provide insights into workforce management, turnover rates, capacity, and other HR and financial considerations.