In school, we’ve all learned certain strategies, theories, and best practices.
But there are some skills you can never learn at school.
Why? In school, they don’t teach you how to step out of the crowd and be better.
My goal is to reveal the underrated FP&A tactics that helped me progress, and that will help you make a difference in your job.
I’ve learned them from my personal experience and I am glad that I can share them with you.
In this edition, I will reveal my top 5 FP&A tactics, and on top of that, I have prepared something special for you.
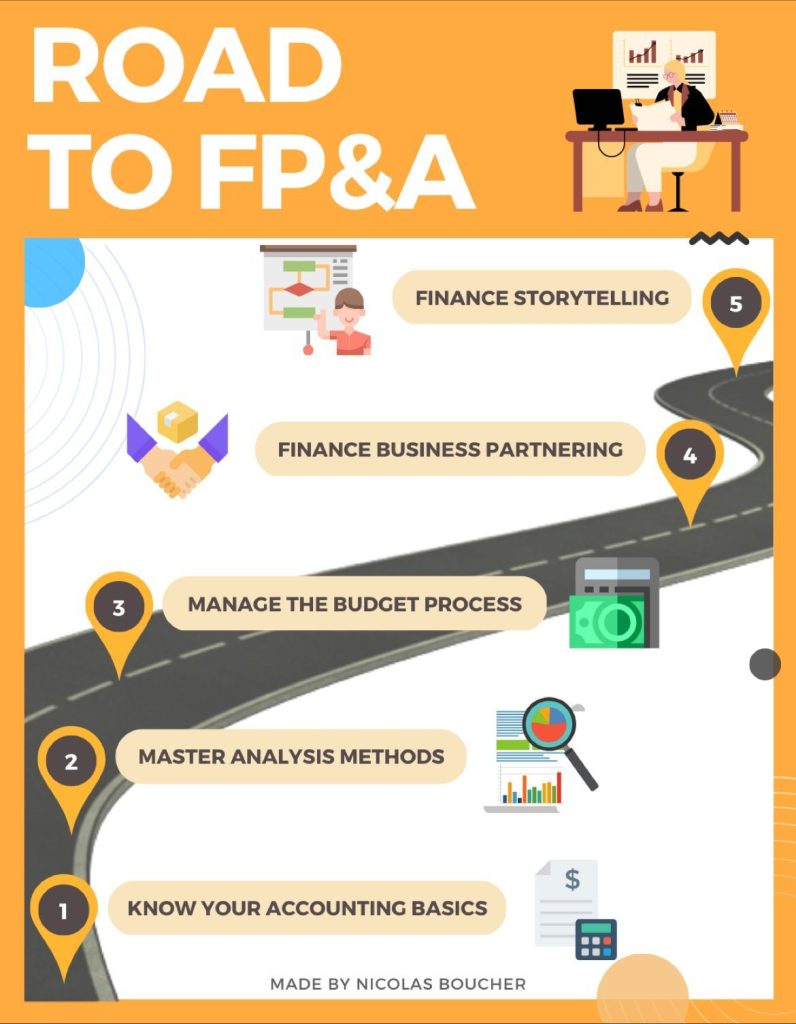
Top 5 FP&A Tactics
Here are the top 5 FP&A tactics I used in my 15 years of experience that helped me progress in my career:
#1: B.O.T.E

B.O.T.E stands for Back-Of-The-Envelope.
B.O.T.E calculations are a skill you need in Board meetings and in your daily activities.
In every meeting I went to, when there was a question about numbers, all eyes looked in my direction.
Why? Because for everybody, finance = numbers.
This means you need to react fast but still not lose your credibility.
Here are my tips:
- Only aim for a rough estimation
- Know the basic numbers of your company
- Use arithmetic shortcuts and principles
#2: PVM Analysis

I am always surprised that they don’t teach that at school.
PVM analysis is a powerful method that helps us understand the profitability of our products or services.
By breaking down revenue or margin into its components – price, volume, and mix – we can identify the drivers of profitability and make strategic decisions to optimize our business.
PVM analysis enables us to assess the impact of pricing or margin changes, sales volume variations, and product or customer mix shifts.
Price Volume Mix is the best analysis method for comparing sales, margin, or even payroll costs.
Where to use PVM Analysis:
- Product Decisions: Identify top-performing and underperforming products
- Pricing: Gauge effects of price changes on profitability
- Margin: Applied to margin instead of revenue, PVM helps you understand your margin variances
#3: Listen to Your Business Partners

Listening actively to your business partners is pivotal.
Their insights can guide your focus, ensuring that your efforts align with the current business challenges.
Why? Let’s be honest; it’s often the case that finance isolates itself and will work on the wrong priorities.
In my career, this was one of the skills that was most appreciated by my business partners. It made my work more valuable and recognized.
My Practical Tips:
- Regular Check-ins: Schedule consistent meetings with stakeholders.
- Open Questions: Encourage partners to express their needs.
- Prioritize: Align your tasks with business goals.
- Feedback Loops: Ensure ongoing communication for adjustments.
- Stay Updated: Be aware of operational changes and challenges.
#4: Excel, PowerPoint, and now ChatGPT
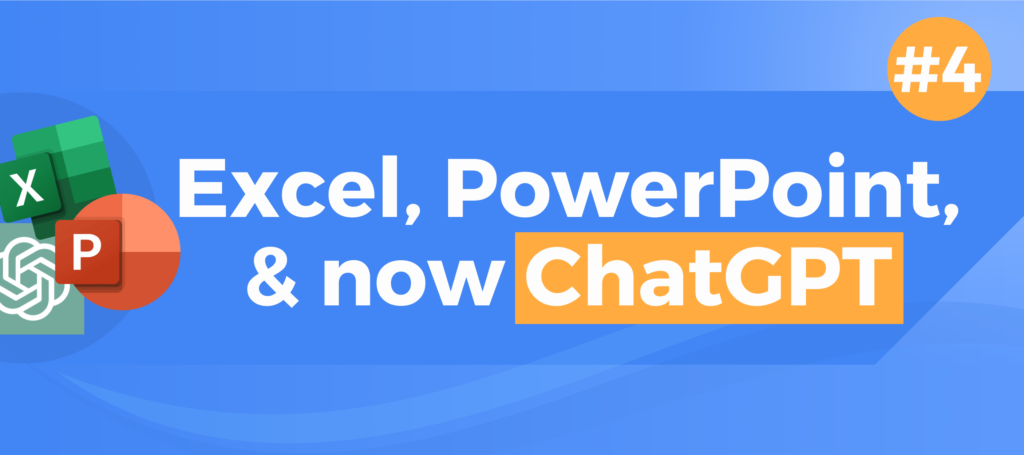
Excel and PowerPoint are indispensable tools in the modern business landscape.
It’s not a surprise that these skills are important in Finance.
However, mastering pivot and index/match for Excel is another dimension.
You most likely work with PowerPoint every day, but can you use SmartArt to make a professional presentation in 5 minutes?
Mastering their specific functionalities can drastically improve productivity and effectiveness.
Excel Practical Tips:
- Shortcuts: Familiarize yourself with key shortcuts for efficiency.
- Data Validation: Use drop-down lists to ensure data consistency.
- Pivot Tables: Summarize large data sets quickly.
- Charts: Visualize data for better insights.
- Conditional Formatting: Highlight specific data points based on criteria.
PowerPoint Practical Tips:
- Consistent Design: Use templates for a uniform look and feel.
- Animations: Use sparingly to emphasize, not distract.
- High-Quality Images: Ensure clarity and relevance.
- Bullet Points: Keep them concise and focused.
- Practice: Rehearse presentations to refine timing and flow.
Now, mastering ChatGPT is what can set you up from the crowd.
Use ChatGPT for
- Long and complex communications
- Drafting procedures (you can draft procedures in a few minutes)
- Problem-solving (imagine, for example, creating a cash action plan)
- Tool tutorials: Make ChatGPT your Excel instructor, available 24/7 for you
- Financial analysis: get help from ChatGPT to structure your analysis
#5: Storytelling

Financial Storytelling was, for me, a revelation over the last 10 years.
The impact of Storytelling in your career can be summarized by this quote:
“The world rewards the people who are best at communicating ideas, not the people with the best ideas.”
This means that you will only be as good as you can communicate.
Here’s what you need to focus on:
1. Preparation
Allocate dedicated time. It’s beyond just slides.
Remember that how you communicate an idea is as important as the idea itself.
2. Messages
Identify core points to convey. People only remember one or two messages from an email or a presentation.
Make sure you know exactly what you want them to remember from your communications.
3. Audience Insight
Understand expectations from your stakeholders and adapt to them.
Another thing is to avoid unpleasant surprises. If there is a piece of important information, don’t wait to escalate it.
You are not responsible if something bad happens in the business. But you are responsible for how and when you transmit the information.
Remember, giving enough time and insights for your management to make decisions helps them in their decision-making process.
The Top 9 FP&A Methods
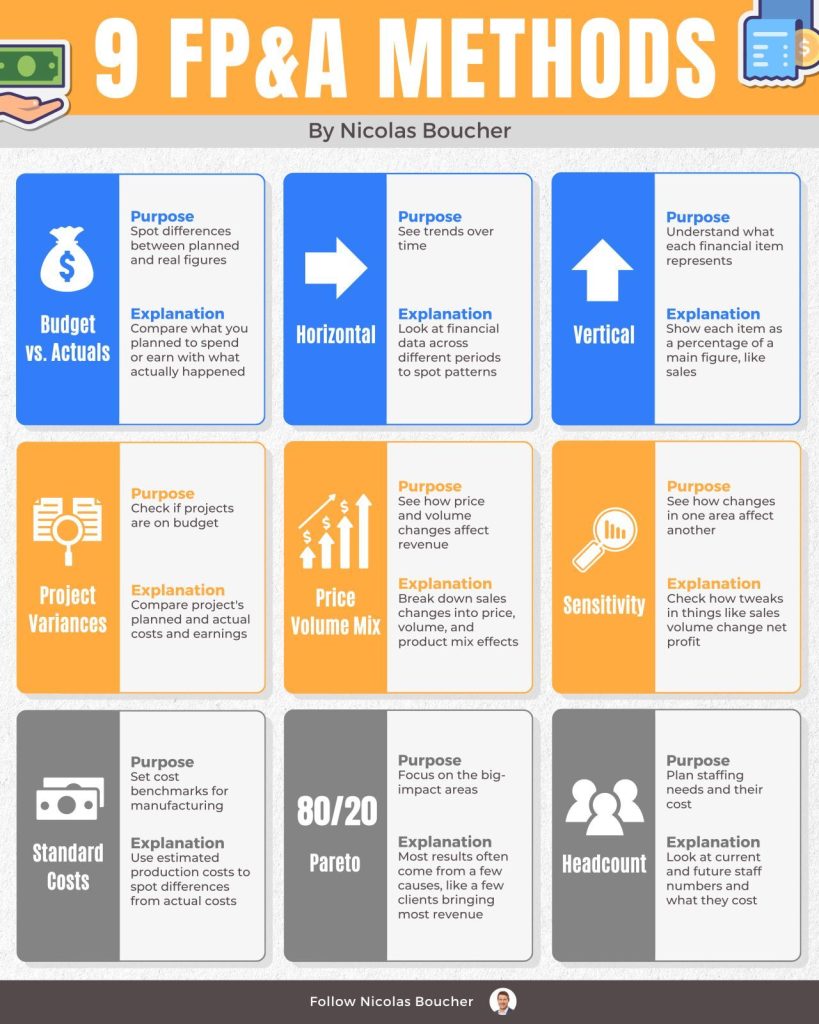
#1: Variance Analysis (Budget vs. Actuals)
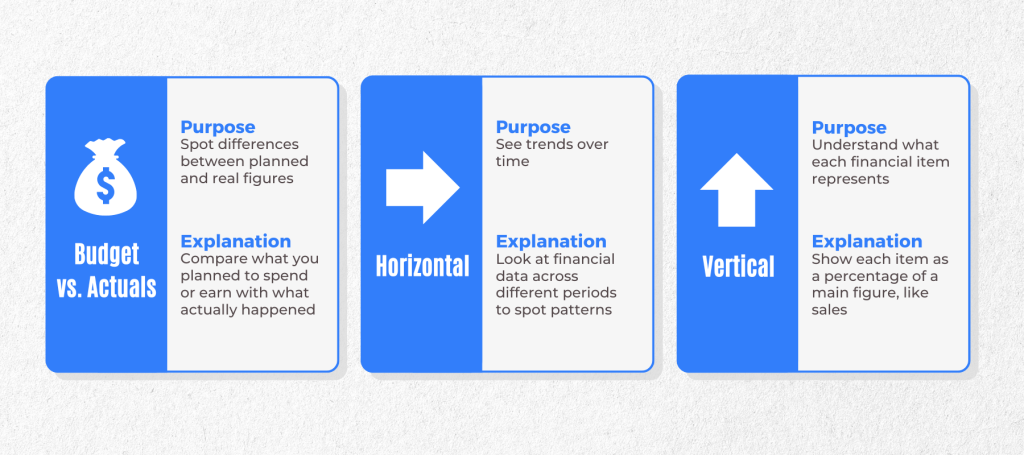
Purpose: Spot differences between planned and real figures
Explanation: Compare planned versus actual expenses/income
When to Use: Use this method at the end of each accounting period to assess performance
Why Is It Important: It helps identify deviations from the budget, allowing for corrective actions and better future planning
#2: Horizontal Analysis
Purpose: Observe patterns as time progresses
Explanation: Look at financial data across different periods to spot patterns
When to Use: Utilize this method for quarterly or annual financial reviews
Why Is It Important: It highlights trends and growth patterns over time, aiding long-term strategic planning
#3: Vertical Analysis
Purpose: Understand what each financial item represents
Explanation: Show each item as a percentage of a main figure, like sales
When to Use: Apply this method during financial statement analysis
Why Is It Important: It provides insight into the structure of financial statements and helps identify areas of concern or opportunity
#4: Project Variances

Purpose: Check if projects are on budget
Explanation: Compare project’s planned and actual costs and earnings
When to Use: Use during and after project completion
Why Is It Important: Ensures projects are financially viable and helps in managing resources effectively
#5: Price Volume Mix (PVM) Analysis
Purpose: See how price and volume changes affect revenue
Explanation: Break down sales changes into price, volume, and product mix effects
When to Use: Conduct this analysis during sales reviews
Why Is It Important: It helps in understanding the impact of pricing and sales volume changes on revenue, aiding in strategic pricing decisions
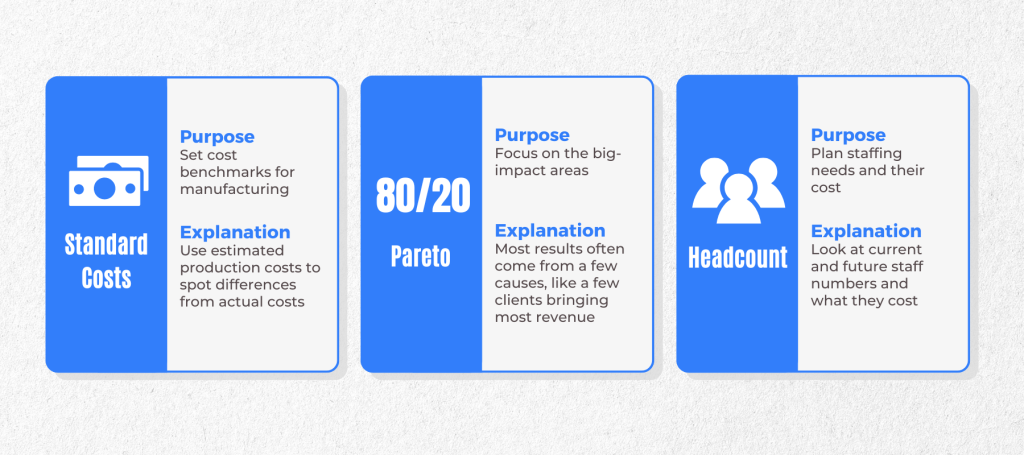
#6: Standard Costs
Purpose: Set cost benchmarks for manufacturing
Explanation: Use estimated costs to detect variances from actual production costs
When to Use: Implement this method in manufacturing cost control
Why Is It Important: It helps in controlling production costs and improving efficiency
#7: Sensitivity Analysis
Purpose: See how changes in one area affect another
Explanation: Check how tweaks in things like sales volume change net profit
When to Use: Use this analysis for risk assessment and scenario planning
Why Is It Important: It provides a better understanding of financial risk and helps in making informed decisions under uncertainty
#8: Pareto Analysis
Purpose: Concentrate on the key areas that have a significant impact
Explanation: Few causes drive most results, e.g., key clients generating primary revenue
When to Use: Apply this method when prioritizing efforts and resources
Why Is It Important: It helps in focusing on the most impactful areas, ensuring efficient use of resources
#9: Headcount Analysis
Purpose: Assess the impact of workforce changes on performance
Explanation: Analyze employee numbers and their cost implications
When to Use: Use during budgeting and workforce planning
Why Is It Important: It aids in managing labor costs and optimizing workforce productivity
Summary
These top 5 FP&A tactics have been my go-to strategies throughout my career.
They’ve helped me solve real problems, make better decisions, and get noticed in meetings.
I’ve learned that it’s not just about being good with numbers; it’s about being quick, clear, and connected to the business.
These tactics aren’t just things I’ve picked up – they’re what have kept me ahead, and I believe they can do the same for you.
FAQ
Q: What is B.O.T.E, and why is it important in FP&A?
A: B.O.T.E stands for Back-Of-The-Envelope calculations, a quick estimation method used in meetings and daily activities to respond to numerical questions promptly. It’s essential because it allows FP&A professionals to provide rapid, credible answers, reinforcing their role as reliable financial experts.
Q: How can PVM Analysis improve my decision-making process?
A: PVM Analysis breaks down revenue or margin into Price, Volume, and Mix components, helping you identify key drivers of profitability. It’s a versatile tool for making data-driven decisions in pricing, product mix, and margin management, ultimately optimizing business performance.
Q: Why is listening to business partners crucial for FP&A professionals?
A: Listening actively to your business partners helps you understand their needs and align your work with the company’s strategic priorities. This collaboration builds trust, ensures you’re addressing relevant challenges, and enhances the impact and recognition of your financial insights.
Q: How can mastering Excel, PowerPoint, and ChatGPT give me an edge in FP&A?
A: Proficiency in Excel, PowerPoint, and ChatGPT boosts productivity and communication skills. Excel’s advanced functionalities, PowerPoint’s design efficiency, and ChatGPT’s capabilities for drafting, problem-solving, and analysis allow you to work smarter and present data compellingly, setting you apart from your peers.
Q: What role does storytelling play in financial analysis?
A: Storytelling transforms data into compelling narratives that resonate with stakeholders. By focusing on clear messages, understanding your audience, and preparing thoroughly, storytelling enhances your ability to communicate complex financial insights effectively, driving better decision-making and career growth.