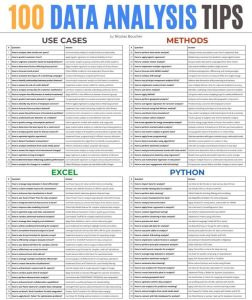


Are you looking for the best way to present some data? How can we decide which data visualization method to use when there are so many options?
To choose which data relationship is most crucial to your story, there are certain categories. Then, take a look at the many types of charts inside each category to get a sense of what could work best.
This list is a helpful place to start when creating informative and relevant data visualization, but it is neither exhaustive nor a magic bullet.
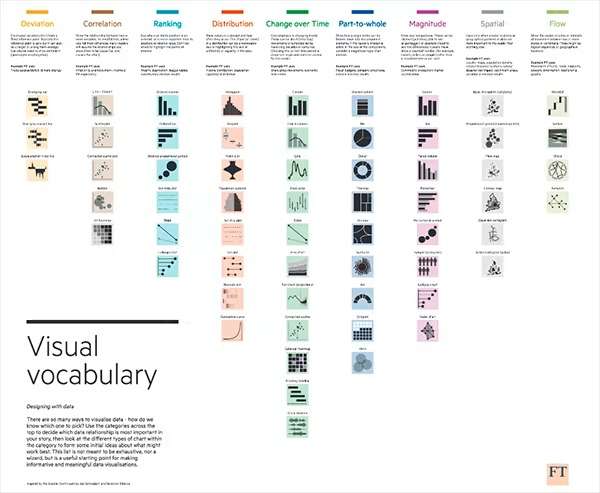
In this guide, the visualizations are arranged by type of data relationship, and then you have a short explanation to guide you in choosing the most appropriate chart.
Table of Contents
Categories for Data Visualization
Here are the categories for data visualization.
#1: Deviation
Emphasize deviations (plus/minus) from a constant reference point. The reference point is usually zero, although it can also represent a goal or an average over a long period of time. Also, it is useful for expressing emotion (positive, neutral, or negative).
Example: Trade surplus/deficit, climate change
#2: Correlation Data Visualization
Demonstrates the connection between two or more variables. Be aware that unless you tell them differently, most readers will assume that the connections you present are causative, meaning that one causes the other.
Example: Unemployment and inflation, income and life expectancy
#3: Ranking
Use whenever the order of an item in a list outweighs its relative or absolute value. Therefore, don’t be scared to draw attention to the important details.
Example: Richness, league tables, and outcomes of elections
#4: Distribution
Displays the values in a dataset together with their frequency. In other words, a distribution’s shape (or “skew”) might serve as a memorable approach to drawing attention to the data’s lack of equality or homogeneity.
Example: Population (age/sex) and income distribution
#5: Change Over Time
Puts a focus on evolving trends. These can range from brief (daily) motions to lengthy sequences that span decades or centuries: In order to provide the reader with appropriate background, it is crucial to choose the appropriate time period.
Example: Changes in share prices and economic time series
#6: Part-To Whole Data Visualization
Demonstrates the division of a single entity into its constituent parts. Therefore, consider a magnitude-type chart for data visualization if the reader is just interested in the components’ sizes.
Example: Fiscal budgets, corporate structures, and election results
#7: Magnitude
Display size disparities. These may be related (merely having a vision larger/bigger) or imperative (must see fine differences). Typically, these display a “counted” number (for instance,
barrels, money or individuals) as opposed to a computed percentage or rate.
Example: Market capitalization and commodity production
#8: Spatial Data Visualization
Used for data visualization only when exact geographic locations or data patterns exist that are more significant than everything else in the reader’s eyes.
Example: Locator maps, population density, locations of natural resources, the chance and effect of natural disasters, catchment regions
#9: Flow
Demonstrates to the reader the amounts or rates of change between two or more states or circumstances. These might be physical sites or logical sequences.
Example: Financial flow, commerce, migrant flow, legal disputes, information flow, and connection graphs
Here is an illustration of the data visualization categories.
Conclusion – Data Visualization Is a Must for Finance
Using visual information, data visualization offers a rapid and efficient method for disseminating information across cultures. Additionally, the practice can assist businesses in determining the variables that influence client behavior and identify areas that require improvement or additional attention. Furthermore, it makes data more memorable for stakeholders, figures out the best times and locations to sell particular products, and forecasts sales volumes.
If you want to receive more finance tips like this, feel free to sign up for my newsletter. If you subscribe, every two weeks, you will receive an email from where I share best practices, career advice, templates, and insights for Finance Professionals.