

Do you know how important it is to analyze variances efficiently? Your management team should be able to use the insights from your report to guide their analysis and decision-making. It should be simple to make, quick to read, and visually present the facts.
Do you need too much time to analyze variances efficiently? Before, when I analyzed variances, I often filtered by high values and low values. Or I sorted the variances from high to low and then low to high. Here is my tip on how to analyze variances efficiently.
Table of Contents
Tip to Analyze Variances
Problem:
You need to filter or sort twice to identify the most significant variances. However, I have found a better alternative, and that is conditional formatting.
What Is Conditional Formatting?
Data that satisfies one or even more conditions can have specific formatting applied using Excel Conditional Formatting. By altering the fill color, font color, and border style of the cells, you may highlight and distinguish your data in many ways, just as with regular cell formatting. However, the main distinction is that it is more adaptable and dynamic; as soon as data changes, conditional forms are instantly changed to reflect new information.
Here is how you can find conditional formatting in Excel to analyze variances efficiently.
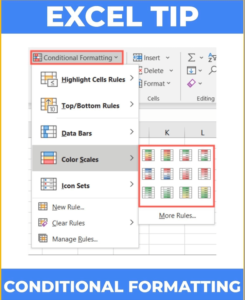
How to use it?
- Apply the conditional formatting function
- Choose the color scale option
- This will automatically highlight your highest values in green and lowest value in red
Here you go; you have your outliers! Now starts the most interesting part where you can add the most value. And where it‘s hard to delegate to a robot. The investigation!
Conclusion
The majority of businesses develop plans and budget’s to set goals for future performance in areas like sales, manufacturing, operations, labor, etc. These plans and the budget’s first estimations are frequently projected cost and revenue forecasts. The objective is to stick to these budgets, but like with any objective, it’s not always possible.
As a result, to monitor actual performance in relation to these objectives, managers employ variance analysis. Finally, budgeting serves no purpose if this analysis is not done. Therefore, it is important to analyze variances efficiently.
If you want to receive more finance tips like this, feel free to sign up for my newsletter. If you subscribe, every two weeks, you will receive an email from where I share best practices, career advice, templates, and insights for Finance Professionals.