


Excel is more than just a spreadsheet tool; it’s a powerful ally in managing data, making decisions, and visualizing information.
Whether you’re in finance, project management, or any field that relies on data, knowing how to use Excel formulas can make your work easier and more accurate.
In this guide, I will provide you with my Top 21 Excel Formulas and give you a glimpse into how they can boost your productivity.
Table of Contents
Top 21 Excel Formulas
Here’s a preview of 10 of the 21 formulas you will find inside the PDF:
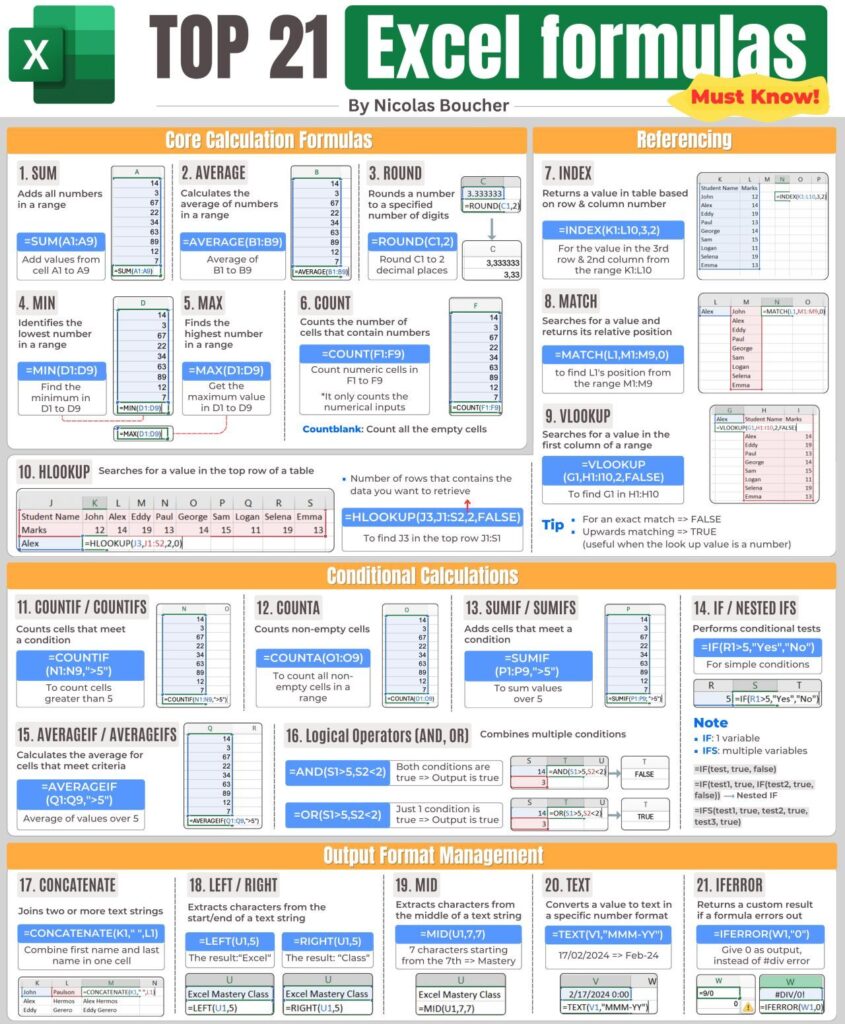
#1 SUM: The Basics of Adding Up
The SUM formula is one of the most used in Excel, and for good reason.
It allows you to add up all the numbers in a specified range, making quick calculations a breeze. For example, using =SUM(A1:A9) will sum all the values from cell A1 to A9.
#2: AVERAGE: Finding the Mean Effortlessly
Need to calculate the average of a set of numbers? The AVERAGE formula has you covered.
This formula takes all the numbers in a range and finds their mean.
For instance, =AVERAGE(B1:B9) will give you the average of the numbers in cells B1 through B9.
#3: ROUND: Simplify Your Numbers
The ROUND formula is perfect for when you need to round numbers to a specific number of decimal places.
If you want to round the value in cell C1 to two decimal places, you would use =ROUND(C1, 2).
#4: MIN: Finding the Lowest Value
When you’re looking for the smallest number in a range, the MIN formula is your go-to.
By using =MIN(D1:D9), Excel will tell you the minimum value found within cells D1 to D9.
#5: MAX: Identifying the Highest Number
Conversely, the MAX formula helps you find the largest number in a range.
Typing =MAX(D1:D9) will reveal the maximum value in the specified range.
#6: COUNT: Counting Numeric Cells
If you need to count how many cells in a range contain numbers, the COUNT formula is what you need.
For example, =COUNT(F1:F9) will count the number of numeric values in cells F1 through F9.
#7: INDEX: Locate Data in a Table
The INDEX formula is incredibly useful for retrieving a specific value from a table based on the row and column number you specify.
For instance, =INDEX(K1:L10, 2, 3) will return the value in the 2nd row and 3rd column within the range K1.
#8: MATCH: Pinpointing Positions in a Range
The MATCH formula helps you find the position of a specific value within a range.
If you want to know where L1 falls within the range M1 to M9, you’d use =MATCH(L1, M1:M9, 0).
#9: VLOOKUP: Searching Vertically in a Range
VLOOKUP is a powerful formula for finding a value in the first column of a range and returning a corresponding value from another column.
For example, =VLOOKUP(G1, H1:H10, 2, FALSE) searches for G1 in the first column of H1 to H10 and returns the value from the second column.
#10: HLOOKUP: Searching Horizontally Across Rows
Similar to VLOOKUP but used for rows, HLOOKUP helps you search for a value in the top row of a range and returns a value from a specified row.
For instance, =HLOOKUP(I1, J1:S2, 2, FALSE) finds I1 in the top row of J1 to S2 and returns the corresponding value from the 2nd row.
#11: COUNTIF/COUNTIFS: Counting Specific Conditions
COUNTIF and COUNTIFS help you count cells that meet specific conditions in a range.
For example, =COUNTIF(N1, “>5”) counts the number of cells with values greater than 5.
#12: COUNTA: Counting Non-Empty Cells
The COUNTA formula is used to count non-empty cells in a specified range.
Use =COUNTA(O1) to count all cells that contain data in the range from O1 to O9.
#13: SUMIF/SUMIFS: Conditional Summing
SUMIF and SUMIFS allow you to sum values based on criteria.
For example, =SUMIF(P1, “>5”) will add up the values greater than 5 in the range P1.
#14: IF/Nested IFs: Conditional Logic
The IF formula performs logical tests and returns different values based on the condition.
For instance, =IF(R1>5, “Yes”, “No”) checks if the value is greater than 5. Nested IFs and IFS handle multiple conditions, such as =IF(test1, true, IF(test2, true, false)).
#15: AVERAGEIF/AVERAGEIFS: Conditional Averages
AVERAGEIF and AVERAGEIFS calculate the average of values that meet certain criteria.
Use =AVERAGEIF(Q1, “>5”) to find the average of numbers greater than 5 in the specified range.
#16: Logical Operators (AND, OR): Combining Conditions
Logical operators like AND and OR are used to combine multiple conditions in Excel.
For example, =AND(S1>5, S2<2) returns TRUE only if both conditions are met. Meanwhile, =OR(S1>5, S2<2) returns TRUE if either condition is satisfied.
#17: CONCATENATE: Joining Text Strings
The CONCATENATE function combines multiple text strings into one.
For example, =CONCATENATE(T1, ” “, T2) merges the first name and last name into a single cell.
#18: LEFT/RIGHT: Extracting Text from Strings
LEFT and RIGHT functions are used to extract characters from the start or end of a text string.
For example, =LEFT(U1, 5) retrieves the first five characters, while =RIGHT(U1, 5) captures the last five.
#19: MID: Extracting Middle Text
The MID function allows you to extract characters from the middle of a text string.
For instance, =MID(V1, 7, 7) returns seven characters starting from the 7th character.
#20: TEXT: Formatting Numbers as Text
The TEXT formula converts numbers into text using a specified format.
For example, =TEXT(V1, “MMM-YY”) converts a date like 7/02/2024 into the format Feb-24.
#21: IFERROR: Handling Errors Gracefully
IFERROR returns a custom result when a formula generates an error.
This is useful for cleaning up errors in calculations, ensuring that your spreadsheet outputs are clear and error-free.
Get your free copy of the Top 21 Excel Formulas PDFWhy Are Excel Formulas Important?
Excel formulas have a big role in making sure financial models are accurate, which is key when you’re dealing with forecasts, budgets, and valuations.
In finance, where every number counts, these formulas help keep everything precise and consistent.
When it comes to reporting, Excel formulas make life easier by automating repetitive tasks.
Get my high-quality PDF of the Top 100 Excel Tips to improve your productivity.
This means you can create reports faster and with fewer mistakes, which is crucial when senior management needs them on time.
Formulas also help you make better decisions. CFOs depend on solid data to guide their choices, and Excel gives you the tools to analyze trends, compare different scenarios, and see how the company is really doing.
This insight is invaluable when making strategic decisions.
In terms of risk management, Excel formulas allow you to run what-if scenarios and stress tests, helping you spot potential risks before they become problems.
Being able to plan for different outcomes is a huge advantage in finance.
Lastly, using Excel formulas ensures that everyone on your team is on the same page.
It keeps things consistent, so everyone’s working with the same data and methods.
For finance pros, getting comfortable with Excel formulas isn’t just useful—it’s essential for doing the job well.
So, don’t wait any longer; grab your copy of formulas and increase your work efficiency!
Get your free copy of the Top 21 Excel Formulas PDF12 Excel Charts You Probably Don’t Know
Here is everything you need to know about the charts:
#1: Heat Map
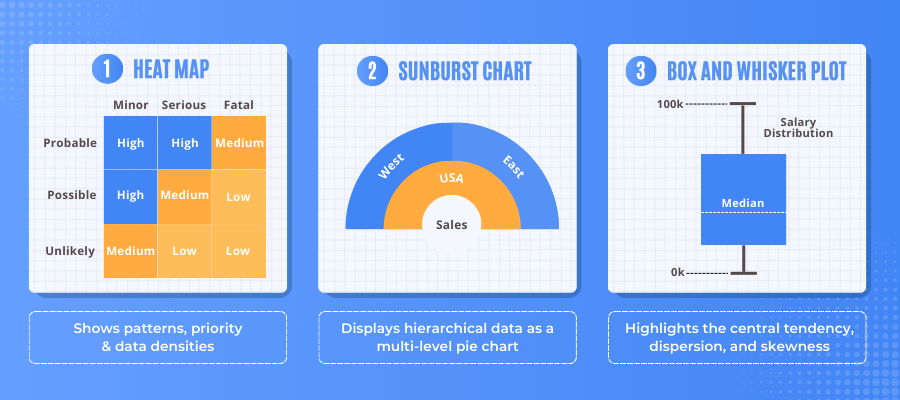
Description: Shows patterns, variances, and densities of data.
How to do it in Excel: Use conditional formatting or third-party Excel add-ins.
Use Cases: Analyzing risk distribution, financial performance across regions, or investment opportunities.
#2: Sunburst Chart
Description: Displays hierarchical data as a multi-level pie chart.
How to do it in Excel: Insert tab > Hierarchy chart > Sunburst.
Use Cases: Visualizing sales source or expense categories
#3: Box and Whisker Plot
Description: Highlights the central tendency, dispersion, and skewness of data.
How to do it in Excel: Insert tab > Charts > Box & Whisker.
Use Cases: Salary distribution across departments, Price distribution across products, Sales distribution across regions.
#4: Pareto Chart
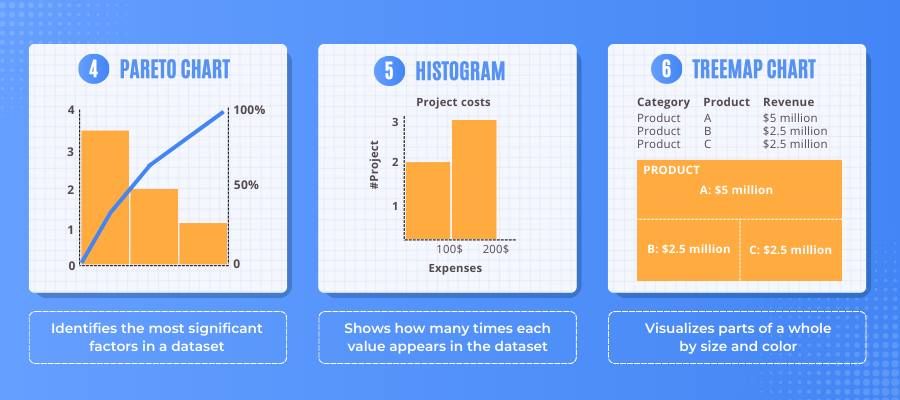
Description: Identifies the most significant factors in a dataset.
How to do it in Excel: Insert tab > Histogram > Pareto Chart.
Use Cases: Identifying major causes of financial discrepancies, prioritizing cost reduction efforts, or analyzing revenue sources.
#5: Histogram
Description: Shows how many times each value appears in the dataset.
How to do it in Excel: Insert tab > Charts > Histogram.
Use Cases: Distribution of asset returns, income level distribution, or expense categorization.
#6: Treemap Chart
Description: Visualizes parts of a whole by size and color.
How to do it in Excel: Insert tab > Hierarchy chart > Treemap.
Use Cases: Allocating resources, analyzing portfolio composition, or visualizing revenue streams.
#7: Sparkline Chart
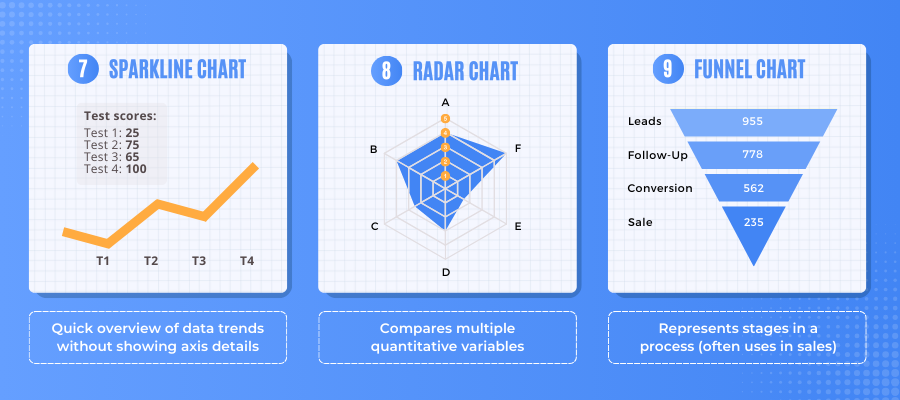
Description: Provides a quick overview of data trends without detailed axis information.
How to do it in Excel: Insert tab > Sparklines.
Use Cases: Tracking financial metrics over time or monitoring project progress.
#8: Radar Chart
Description: Compares multiple quantitative variables.
How to do it in Excel: Insert tab > Charts > Radar.
Use Cases: Performance analysis across different financial metrics, comparison of subsidiaries performance, or analysis of competitor profiles.
#9: Funnel Chart
Description: Represents stages in a process.
How to do it in Excel: Insert tab > Charts > Funnel.
Use Cases: Sales process analysis, conversion rates, or identifying potential leaks in processes.
#10: Scatter Plot
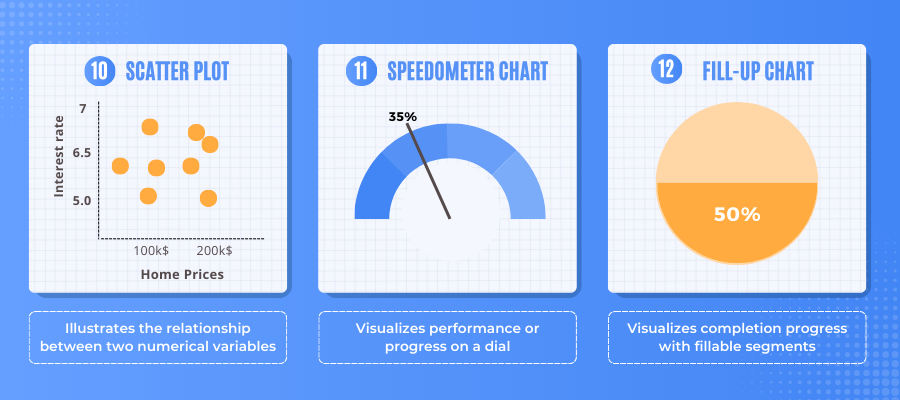
Description: Illustrates the relationship between two numerical variables.
How to do it in Excel: Insert tab > Charts > Scatter.
Use Cases: Identifying correlations between financial variables or risk-return analysis
#11: Speedometer chart
Description: Visualizes performance or progress on a dial
How to do it in Excel: Insert tab > Charts > Radar
Use Cases: Monitor KPIs, assess project progress, track budget in corporate finance
#12: Fill-up Chart
Description: Visualizes completion progress with fillable segments
How to do it in Excel: Insert tab > Pie chart > Donut chart
Use Cases: Visualize project, goal, or survey progress
Excel vs. Power BI
Which one should you use and when?
Choosing between Excel and Power BI can be tricky when it comes to data analysis.
Here’s a straightforward comparison to help you decide:
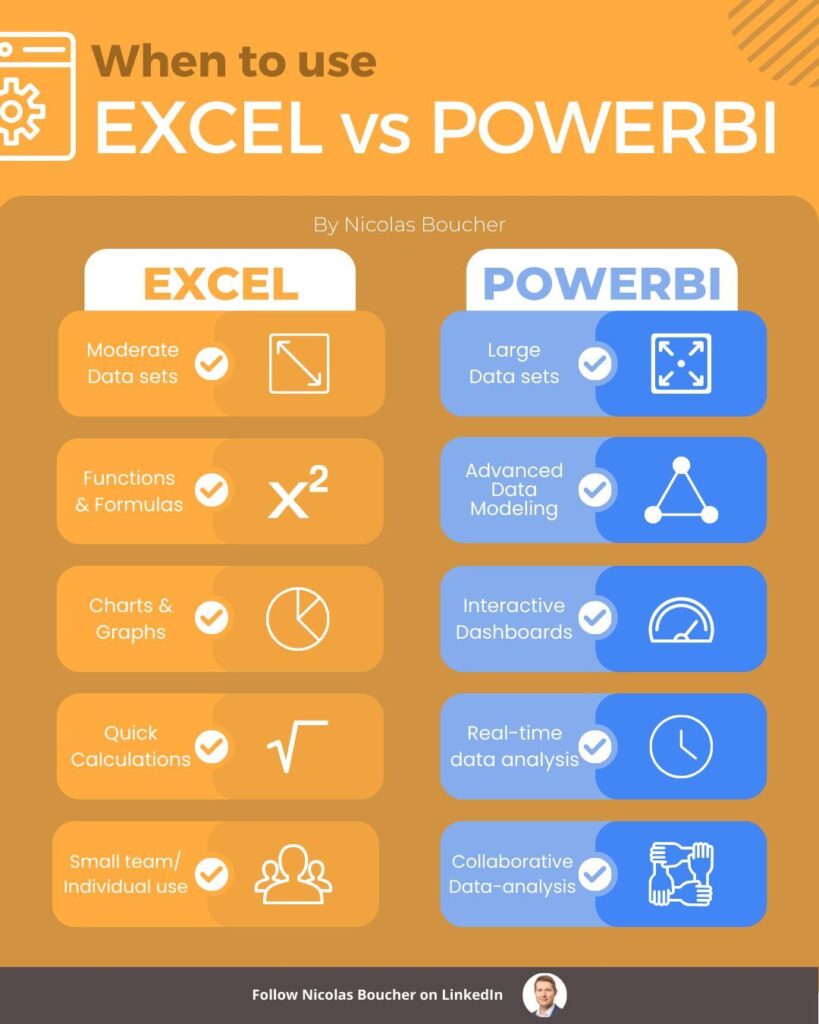
When to Use Excel
Excel is your go-to tool for quick calculations, making it perfect for simple, on-the-fly math tasks.
It’s also ideal when you’re dealing with small data sets, typically those with less than 100 lines.
If you need to perform ad-hoc analysis, such as quick investigations or one-off tasks, Excel excels in these scenarios.
It’s also great for basic visualizations, like straightforward charts and graphs, and works well for individual projects or small teams.
Get your free copy of the Top 21 Excel Formulas PDFWhen to Use Power BI
On the other hand, Power BI shines when you’re working with large or complex data sets.
It’s built to handle big data with ease, making it perfect for more extensive data analysis.
Power BI is also excellent for real-time analysis, offering up-to-the-minute insights that are crucial in dynamic environments.
If you’re working on a collaborative project that spans multiple departments, Power BI’s design is geared towards teamwork.
Additionally, it’s the tool of choice for creating advanced, interactive visualizations and is particularly powerful in predictive analytics and forecasting.
Final Thoughts
Mastering Excel formulas isn’t just about getting the job done – it’s about doing it better, faster, and with more confidence.
From simple calculations to advanced data analysis, these formulas are essential tools that can help you tackle any data-related task with ease.
Even if you’re just starting with Excel or looking to refine your skills, understanding these formulas will undoubtedly give you an edge.
So, dive into my Top 21 Excel Formulas and practice to see how they will transform your workflow.
If you want to learn to use AI for Excel and become a proficient Excel user, then this is the right course for you. Even as an Excel and AI expert, I learned a lot with her course, and she made it really easy to follow along.
This course teaches you how to use AI tools like ChatGPT and Copilot, as well as the new AI-driven functions, to unlock Excel’s full potential.
Get your free copy of the Top 21 Excel Formulas PDFFAQ
Q: Why should I learn Excel formulas if I already know the basics?
A: Learning Excel formulas takes your skills to the next level. While the basics help you get by, formulas allow you to automate tasks, analyze data more effectively, and make better decisions based on accurate information. It’s a way to work smarter, not harder.
Q: How do I know when to use Excel versus Power BI?
A: Excel is best for quick calculations, small data sets, and simple visualizations. If you’re dealing with larger, more complex data or need real-time analysis and advanced visualizations, Power BI might be the better choice. It’s all about matching the tool to the task.
Q: What are some common mistakes to avoid when using Excel formulas?
A: Common mistakes include not double-checking your formulas for errors, using absolute versus relative references incorrectly, and not keeping your data organized. Always review your work and make sure your formulas are applied correctly to avoid mistakes.
Q: Can Excel formulas be used for collaborative work?
A: Yes, Excel formulas can be used in collaborative environments, but they require clear communication and consistent practices among team members. For more complex, collaborative projects, tools like Power BI might offer better features for teamwork.
Q: How can I learn more Excel formulas beyond the basics?
A: You can learn more by practicing with real data or exploring Excel’s built-in help feature. There are also many tutorials and guides available online that can help you master more advanced formulas and techniques.