

Data analysis can be a really frustrating part of your work in finance, whether you’re dealing with sales trends, forecasting, or performance metrics.
However, spending hours analyzing data doesn’t have to be the norm.
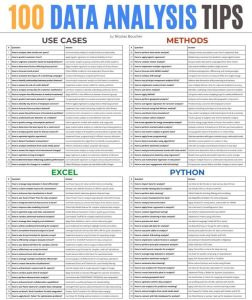
That’s why I’ve created a cheat sheet with 100 practical tips to help you analyze data more effectively and efficiently.
This resource is packed with insights to help you streamline your analysis and make better data-driven decisions.
In today’s blog, learn why you need to have it and what are the 4 types of data analysis.
Table of Contents
100 Data Analysis Tips
Data analysis can cost you a lot of valuable time, no matter the method you are using.
Finding a way to do things easier and smarter will help you avoid spending hours on analysis.
Considering that, I’ve worked and crafted a cheat sheet containing the top 100 Data Analysis Tips.
Claim your free high-quality PDF copy of the cheat sheet now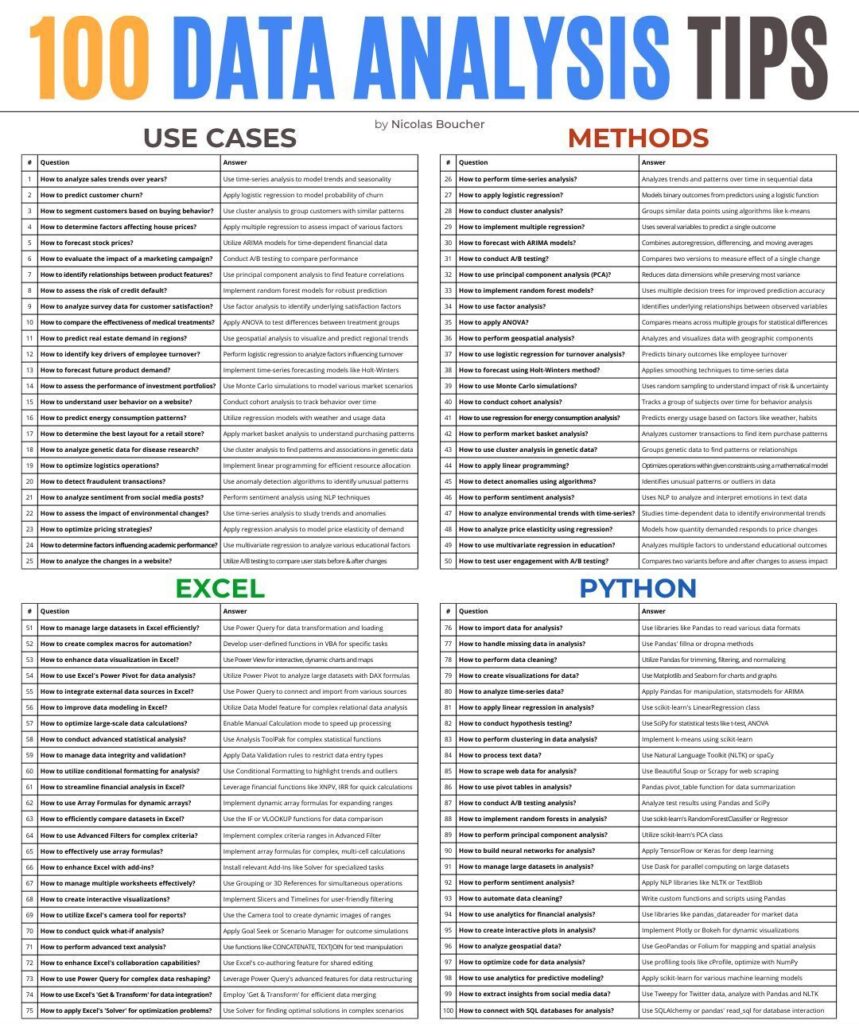
Here’s what is included in the Top 100 Data Analysis Tips cheat sheet:
Data Analysis Tips – Use Cases
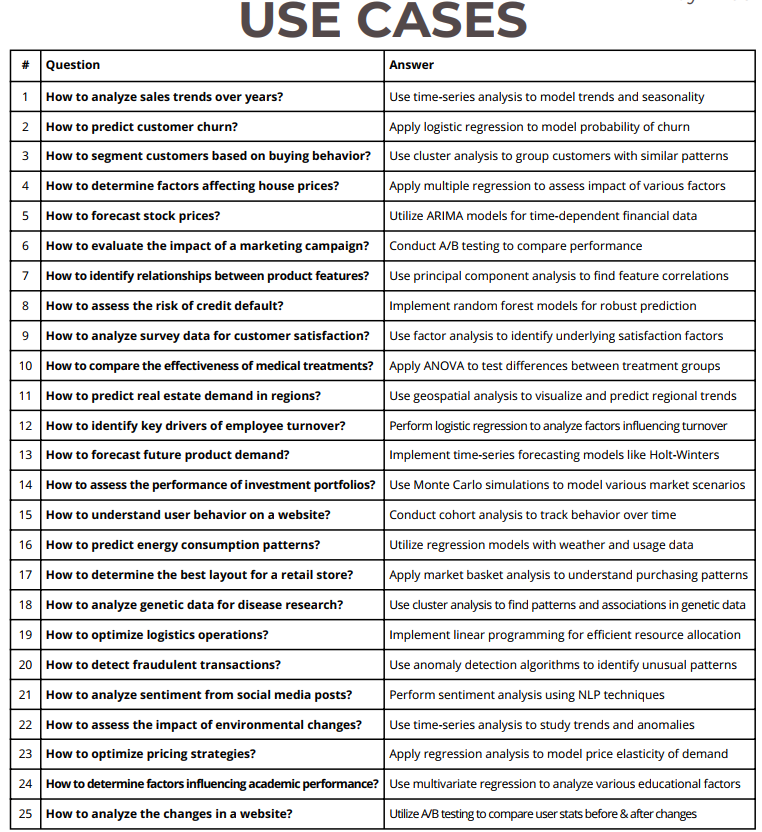
1. How do you analyze sales trends over the years?
A: Use time-series analysis to model trends and seasonality.
Analyzing sales trends over the years starts by collecting historical sales data at regular intervals, such as daily, monthly, or yearly.
Visualize this data using line charts to observe trends and any seasonal patterns.
Next, decompose the time-series data into its trend, seasonal, and residual components to understand each element’s influence.
You can further clarify long-term trends by applying smoothing techniques like moving averages.
Finally, forecasting models such as ARIMA or exponential smoothing can be used to make informed predictions about future sales.
2. How to predict customer churn?
A: Apply logistic regression to model the probability of churn.
To predict customer churn, data on customer interactions, purchase history, and relevant behavioral metrics must be gathered.
Clean and preprocess the data by handling missing values and encoding any categorical variables to make the dataset suitable for modeling.
Split the data into training and testing subsets to evaluate the model’s performance.
Train a logistic regression model on the training data, then assess its accuracy, precision, and recall using the test set.
Once validated, the model can be used to predict churn probabilities, helping businesses proactively retain at-risk customers.
3. How do you segment customers based on buying behavior?
A: Use cluster analysis to group customers with similar patterns.
Segmentation based on buying behavior involves collecting data on customer purchases, frequency, and recency, among other relevant metrics.
Normalize this data to ensure all variables are comparable.
Choose a clustering algorithm such as K-means or hierarchical clustering, and determine the optimal number of clusters using techniques like the elbow method.
Fit the model to the data to segment customers into distinct groups. Finally, the characteristics of each cluster are analyzed to tailor marketing and sales strategies to each specific customer group.
4. How do you determine factors affecting house prices?
A: Apply multiple regression to assess the impact of various factors.
To determine factors affecting house prices, collect data on house prices along with potential influencing factors such as size, location, and amenities.
Clean the dataset by removing any outliers and addressing missing values.
Conduct exploratory data analysis to visualize and understand the relationships between variables.
Fit a multiple regression model with house prices as the dependent variable and analyze the regression coefficients to gauge each factor’s impact.
Validate the model using statistical measures like R-squared and residual plots to ensure accuracy.
5. How to forecast stock prices?
A: Utilize ARIMA models for time-dependent financial data.
Forecasting stock prices involves first collecting historical stock price data.
Check the stationarity of the data using statistical tests such as the Augmented Dickey-Fuller test, and transform the data if necessary by differencing or taking logarithms.
Use ACF and PACF plots to identify the parameters for the ARIMA model, then fit the model with the identified values.
Validate the model’s performance using testing data and, once confirmed, use it to make predictions about future stock prices.
6. How to evaluate the impact of a marketing campaign?
A: Conduct A/B testing to compare performance.
To evaluate a marketing campaign, define a clear goal, such as increasing sales or clicks.
Split your audience into two groups: a control group receiving the standard campaign and a test group receiving the new version.
Run both campaigns concurrently and collect performance data from each group.
Use statistical tests, like a t-test, to compare the results and determine if the changes made to the test campaign significantly impacted performance.
This method allows you to make data-driven decisions about campaign adjustments.
7. How do we identify relationships between product features?
A: Use principal component analysis to find feature correlations.
Identifying relationships between product features starts by collecting data on those features and standardizing them to ensure consistency in scale.
Perform Principal Component Analysis (PCA) to reduce the dimensionality of the dataset, focusing on the principal components that capture the most variance.
Analyze these components to uncover which features are highly correlated.
Visualize the relationships using biplots to enhance interpretation, helping in understanding key product attributes that drive performance.
8. How to assess the risk of credit default?
A: Implement random forest models for robust prediction.
To assess credit default risk, gather data on borrower profiles, including financial history and any instances of previous defaults.
Preprocess this data by handling missing values and encoding categorical variables.
Split the dataset into training and testing sets.
Train a random forest classifier on the training data and evaluate its performance using accuracy, precision, and ROC-AUC metrics.
Once the model is validated, it is used to predict the likelihood of default for new borrowers, assisting in decision-making for credit approvals.
9. How to analyze survey data for customer satisfaction?
A: Use factor analysis to identify underlying satisfaction factors.
Analyzing survey data for customer satisfaction involves collecting responses and organizing them into a structured dataset.
Standardize the data, especially when using scales like Likert.
Conduct factor analysis to extract latent factors that summarize the data’s variance, revealing underlying dimensions of satisfaction.
Rotate the factors using techniques like Varimax for better interpretability, allowing you to pinpoint specific areas of strength or concern based on customer feedback.
10. How do we compare the effectiveness of medical treatments?
A: Apply ANOVA to test differences between treatment groups.
Comparing the effectiveness of medical treatments starts with collecting outcome data from various groups.
Check whether the data meets the assumptions for ANOVA, such as normality and homogeneity of variance.
Perform a one-way ANOVA to compare the mean outcomes across the treatment groups.
If significant differences are found, follow up with post-hoc tests to determine which treatments differ.
This approach helps identify which medical interventions are most effective.
11. How to predict real estate demand in regions?
A: Use geospatial analysis to visualize and predict regional trends.
Predicting real estate demand in regions involves collecting data on sales, demographics, and other influencing factors.
Use GIS tools like QGIS to visualize spatial patterns through heat maps and clustering techniques.
Incorporate these spatial variables into regression models to make demand predictions.
By analyzing these trends, you can gain insights into which areas are likely to experience increased real estate activity, aiding in investment decisions.
12. How to identify key drivers of employee turnover?
A: Perform logistic regression to analyze factors influencing turnover.
To identify key drivers of employee turnover, gather data on employee demographics, tenure, job satisfaction, and other relevant attributes.
Preprocess the data to handle missing values and encode categorical variables.
Train a logistic regression model with turnover as the dependent variable and evaluate the significance of each predictor using p-values and coefficients.
This analysis helps pinpoint which factors most strongly influence turnover, allowing targeted retention strategies.
13. How to forecast future product demand?
A: Implement time-series forecasting models like Holt-Winters.
Forecasting future product demand begins with collecting historical sales data.
Visualize the data to identify patterns of seasonality.
Fit a Holt-Winters model, adjusting parameters to capture both trend and seasonal components accurately.
Validate the model against historical data to ensure it provides reliable forecasts.
Use the model’s output to predict future demand, assisting in inventory management and production planning.
14. How to assess the performance of investment portfolios?
A: Use Monte Carlo simulations to model various market scenarios.
Assessing investment portfolio performance involves collecting data on historical returns and asset allocations.
Define the variables, such as expected returns and risk factors, then use Monte Carlo simulations to create thousands of possible future scenarios based on random sampling.
Analyze the simulation results to evaluate potential risks and returns, helping investors make more informed decisions about asset allocations and risk management.
15. How to understand user behavior on a website?
A: Conduct cohort analysis to track behavior over time.
Understanding user behavior through cohort analysis begins by defining cohorts based on characteristics like signup date or first purchase.
Track each cohort’s key metrics, such as retention or engagement rates, over time.
Visualize these trends using cohort analysis charts to identify how different user groups behave.
Use these insights to tailor website features or marketing strategies to improve user experience and engagement.
16. How do we predict energy consumption patterns?
A: Utilize regression models with weather and usage data.
Predicting energy consumption involves collecting historical data on energy usage along with factors such as weather conditions.
Explore relationships between energy consumption and weather variables using scatter plots and correlation analysis.
Fit a regression model that incorporates these predictors, then validate its accuracy using a separate testing set.
Use the validated model to forecast future energy usage patterns, aiding in energy management and planning.
17. How to determine the best layout for a retail store?
A: Apply market basket analysis to understand purchasing patterns.
To optimize a retail store layout, start by collecting transaction data that details items frequently bought together.
Use association rule mining techniques, such as the Apriori algorithm, to identify common item sets.
Analyze these patterns to understand how customers shop and use these insights to adjust the store layout.
Place frequently purchased items near each other to increase sales and test the new layout to refine it based on performance feedback.
18. How to analyze genetic data for disease research?
A: Use cluster analysis to find patterns and associations in genetic data.
Analyzing genetic data involves collecting relevant data such as gene expressions or mutations.
Preprocess the data by normalizing and filtering out noise.
Apply clustering algorithms like K-means to group similar genetic profiles.
Visualize the clusters to identify patterns that could be linked to specific diseases, guiding further research into genetic associations and potential treatment paths.
19. How to optimize logistics operations?
A: Implement linear programming for efficient resource allocation.
Optimizing logistics requires defining an objective function, such as minimizing costs or maximizing delivery efficiency, and identifying constraints like capacity or time limits.
Formulate a linear programming model incorporating these elements, then solve it using optimization software like Solver or Gurobi.
The resulting solution provides the optimal resource allocation strategy, which can be applied to improve logistics efficiency.
20. How to detect fraudulent transactions?
A: Use anomaly detection algorithms to identify unusual patterns.
Detecting fraudulent transactions begins by collecting transaction data and, if available, labeling known fraud cases.
Preprocess the data to clean up noise and remove outliers. Train an anomaly detection model, such as Isolation Forest or Autoencoders, on the dataset.
The model scores transactions based on their likelihood of being anomalous, flagging potential fraud for further investigation.
Continually refine the model based on new data to improve its accuracy.
21. How do you analyze sentiment from social media posts?
A: Perform sentiment analysis using NLP techniques.
Sentiment analysis of social media involves collecting posts through APIs like Twitter API.
Preprocess the text data by tokenizing, removing stop words, and standardizing the text.
Use Natural Language Processing (NLP) tools like TextBlob or VADER to analyze the sentiment of each post, categorizing them as positive, negative, or neutral.
These insights help gauge public opinion and guide strategic decisions based on sentiment trends.
22. How to assess the impact of environmental changes?
A: Use time-series analysis to study trends and anomalies.
To assess environmental changes, collect data over time, such as temperature records or pollution levels.
Visualize the data to identify trends and patterns, then decompose it into trend, seasonal, and residual components to understand underlying influences.
Use statistical tests to detect significant anomalies or changes and interpret the results to evaluate the impact of environmental shifts.
23. How to optimize pricing strategies?
A: Apply regression analysis to model price elasticity of demand.
Optimizing pricing strategies starts with collecting data on sales volume and corresponding prices.
Analyze the relationship between price changes and sales volume using scatter plots and correlation analysis.
Fit a regression model to estimate price elasticity, which quantifies how demand responds to price changes.
Use the model to simulate different pricing scenarios and adjust strategies based on the predicted impact on demand.
24. How do you determine factors influencing academic performance?
A: Use multivariate regression to analyze various educational factors.
To analyze factors influencing academic performance, collect data on grades, attendance, study hours, and other relevant variables.
Explore the relationships using scatter plots and correlations.
Fit a multivariate regression model with academic performance as the dependent variable, and examine the significance of each factor.
Use the insights to recommend changes in educational practices or focus areas to improve student outcomes.
25. How do you analyze the changes in a website?
A: Utilize A/B testing to compare user stats before & after changes.
Analyzing changes to a website involves defining a key performance metric, such as click-through or conversion rates.
Split your audience into a control group that experiences the original site and a test group that sees the modified version.
Collect data on both versions’ performance and use statistical tests to compare outcomes.
This method helps identify whether changes have positively or negatively affected user engagement, guiding decisions on website improvements.
Get the high-quality PDF of the cheat sheet hereData Analysis Tips – Methods
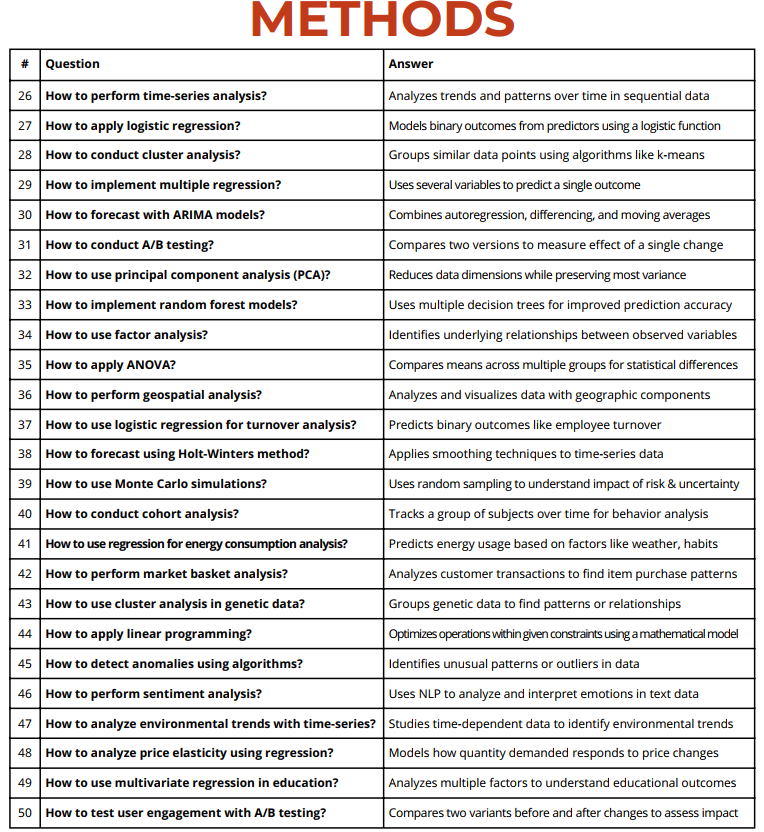
26. How to perform time-series analysis?
A: Analyzes trends and patterns over time in sequential data.
To perform time-series analysis, begin by collecting sequential data points recorded over time, such as daily sales or monthly temperature readings.
Plot the data using line graphs to visualize trends and seasonality.
Decompose the series into its components—trend, seasonal, and residual—to better understand underlying patterns.
Use smoothing techniques like moving averages to identify general trends and apply statistical tests to confirm stationarity.
Finally, models such as ARIMA or Exponential Smoothing can be used to forecast future values based on historical patterns.
27. How to apply logistic regression?
A: Models binary outcomes from predictors using a logistic function.
Applying logistic regression involves gathering data with a binary outcome (e.g., success/failure) and several predictor variables.
Preprocess the data by handling missing values and encoding categorical predictors.
Split the dataset into training and testing subsets.
Train the logistic regression model on the training data, fitting the logistic function to model the probability of the binary outcome.
Assess the model’s performance using metrics such as accuracy, precision, and recall, and use it to make predictions on new data.
28. How to conduct cluster analysis?
A: Groups similar data points using algorithms like k-means.
Conducting cluster analysis starts by collecting data on the variables of interest.
Preprocess the data to standardize or normalize it, ensuring all features contribute equally.
Based on your data and goals, choose a clustering algorithm, such as K-means or hierarchical clustering.
Determine the optimal number of clusters using methods like the elbow or silhouette analysis.
Fit the clustering model to the data, and interpret the resulting groups to identify patterns or similarities among the data points.
29. How to implement multiple regression?
A: Uses several variables to predict a single outcome.
To implement multiple regression, collect data on the dependent variable you want to predict and the independent variables that may influence it.
Clean the dataset by handling outliers and missing data.
Perform exploratory data analysis to check for multicollinearity among predictors.
Fit the multiple regression model by selecting the dependent variable and adding the independent variables to the model.
Analyze the coefficients to understand each variable’s impact, validate the model with statistical measures, and use it for prediction.
30. How do you forecast with ARIMA models?
A: Combines autoregression, differencing, and moving averages.
Forecasting with ARIMA involves collecting historical time-series data and checking for stationarity using tests like the Augmented Dickey-Fuller test.
If the data is non-stationary, apply differencing to remove trends.
Use ACF and PACF plots to determine the ARIMA model parameters (p, d, q).
Fit the ARIMA model to the data and validate its accuracy using a portion of the dataset. Once validated, use the model to forecast future values, accounting for past trends and patterns.
31. How to conduct A/B testing?
A: Compares two versions to measure the effect of a single change.
To conduct A/B testing, define a clear hypothesis and key metrics to evaluate (e.g., conversion rate).
Split your sample into two groups: a control group that receives the original version and a test group that receives the modified version.
Run the experiment concurrently, collecting data on the key metrics from both groups.
Use statistical analysis, such as a t-test or chi-square test, to determine whether the differences in results are statistically significant.
Use these findings to decide whether to implement the change.
32. How to use principal component analysis (PCA)?
A: Reduces data dimensions while preserving most variance.
PCA involves collecting data on multiple correlated variables and standardizing them to ensure uniformity in analysis.
Use the PCA algorithm to transform the original variables into a smaller set of uncorrelated principal components that capture the most variance in the data.
Examine the resulting components to identify which ones explain the most variability, and visualize the results with scree plots or biplots.
This reduction helps simplify complex datasets while retaining critical information.
33. How to implement random forest models?
A: Uses multiple decision trees for improved prediction accuracy.
Implementing random forest models begins with collecting data on predictors and outcomes.
Clean the dataset by handling missing values and encoding categorical variables.
Split the data into training and testing sets, then train the random forest model, which builds multiple decision trees by sampling the data and averaging results.
Evaluate the model’s accuracy, precision, and recall on the test set.
Random forests improve prediction accuracy by reducing overfitting compared to individual decision trees.
34. How to use factor analysis?
A: Identifies underlying relationships between observed variables.
To use factor analysis, start by collecting data on a set of variables believed to be interrelated.
Standardize the data to ensure comparability. Conduct exploratory factor analysis to identify latent factors that group the observed variables.
Rotate the factors using methods like Varimax to enhance interpretability.
The goal is to reduce the dataset’s complexity by summarizing related variables into fewer factors that explain the underlying structure.
35. How to apply ANOVA?
A: Compares means across multiple groups for statistical differences.
Applying ANOVA involves collecting data on the dependent variable across multiple groups.
Check for ANOVA assumptions, such as normality and equal variances among groups.
Perform a one-way ANOVA to test if there are statistically significant differences between the group means.
If the ANOVA is significant, conduct post-hoc tests to identify which specific groups differ.
This approach helps assess whether group variations are due to random chance or actual differences.
36. How to perform geospatial analysis?
A: Analyzes and visualizes data with geographic components.
Geospatial analysis begins by collecting data with spatial components, such as coordinates or geographic areas.
Use GIS software like ArcGIS or QGIS to visualize the data on maps, identifying patterns and relationships within the spatial context.
Perform spatial analysis techniques, such as clustering, hotspot analysis, or spatial regression, to explore geographic trends.
The insights gained can inform decisions based on location-specific data.
37. How to use logistic regression for turnover analysis?
A: Predicts binary outcomes like employee turnover.
Using logistic regression for turnover analysis starts with collecting data on employee attributes such as demographics, tenure, and job satisfaction.
Clean and preprocess the data by encoding categorical variables and handling missing values.
Train a logistic regression model using turnover (e.g., stay or leave) as the binary outcome variable.
Evaluate the model’s performance using metrics like accuracy and the area under the ROC curve.
Use the results to identify key predictors of employee turnover and make data-driven retention strategies.
38. How do you forecast using the Holt-Winters method?
A: Applies smoothing techniques to time-series data.
Forecasting with the Holt-Winters method begins with collecting time-series data that exhibits trend and seasonality.
Visualize the data to identify these patterns and decompose the series if needed. Fit the Holt-Winters model by specifying parameters for level, trend, and seasonality.
Validate the model by comparing forecasts against actual data, adjusting the parameters as necessary. Use the model to forecast future values, incorporating both trends and seasonal effects.
39. How to use Monte Carlo simulations?
A: Uses random sampling to understand the impact of risk & uncertainty.
Monte Carlo simulations involve defining a mathematical model with uncertain variables, such as future stock returns or project costs.
Specify the probability distributions for these variables based on historical data or expert judgment.
Use simulation software to run thousands of random trials, generating a range of possible outcomes.
Analyze the results to assess risk, variability, and potential returns, providing valuable insights for decision-making under uncertainty.
40. How to conduct cohort analysis?
A: Tracks a group of subjects over time for behavior analysis.
Cohort analysis starts by defining cohorts based on shared characteristics, such as the time of acquisition or first purchase.
Track key performance metrics, such as retention or engagement, over specific time intervals for each cohort.
Visualize the trends in cohort performance using heat maps or line charts to identify patterns.
Analyzing these patterns helps understand how user behavior changes over time, allowing for targeted improvements in strategy.
41. How to use regression for energy consumption analysis?
A: Predicts energy usage based on factors like weather and habits.
Energy consumption analysis with regression involves collecting historical energy usage data along with relevant predictors like weather conditions and usage habits.
Explore relationships using scatter plots to identify potential predictive variables.
Fit a regression model, incorporating these predictors to estimate energy consumption.
Validate the model’s accuracy with out-of-sample testing and use it to forecast future energy usage, aiding in demand management and energy efficiency planning.
42. How to perform market basket analysis?
A: Analyzes customer transactions to find item purchase patterns.
Market basket analysis starts by collecting transaction data from point-of-sale systems, detailing which items are bought together.
Use association rule mining techniques, such as the Apriori algorithm, to identify frequent item sets and generate rules that describe purchase patterns.
Analyze the support, confidence, and lift metrics of these rules to assess their strength.
These insights help in making strategic decisions on product placement, bundling, and promotional activities.
43. How to use cluster analysis in genetic data?
A: Groups genetic data to find patterns or relationships.
Cluster analysis of genetic data begins by collecting data on genetic expressions, mutations, or other relevant features.
Preprocess the data by normalizing and filtering noise. Choose a clustering algorithm, such as hierarchical clustering, to group similar genetic profiles.
Visualize the clusters to identify patterns or associations related to specific genetic traits or diseases, supporting further research and potential therapeutic targets.
44. How to apply linear programming?
A: Optimizes operations within given constraints using a mathematical model.
Applying linear programming involves defining an objective function, such as minimizing costs or maximizing output, and identifying constraints like resource availability or production limits.
Formulate the linear programming model by setting up equations that represent the objective and constraints.
Use optimization software like Solver or Gurobi to solve the model and find the optimal solution that meets the constraints. Implement these results to improve operational efficiency.
45. How to detect anomalies using algorithms?
A: Identifies unusual patterns or outliers in data.
Anomaly detection involves collecting data and, if possible, labeling known normal and abnormal cases.
Preprocess the data to clean and remove noise.
Train anomaly detection models like Isolation Forest, Autoencoders, or statistical methods such as z-score analysis.
Use these models to identify data points that deviate significantly from normal patterns, flagging them as potential anomalies.
Regularly update the model with new data to maintain its accuracy.
46. How to perform sentiment analysis?
A: Uses NLP to analyze and interpret emotions in text data.
Performing sentiment analysis begins by collecting text data from sources like reviews, social media, or customer feedback.
Preprocess the text by tokenizing, removing stop words, and normalizing terms.
Use sentiment analysis tools, such as TextBlob, VADER, or more complex models like BERT, to classify the text into positive, negative, or neutral sentiments.
Summarize the overall sentiment scores to gauge public opinion or customer satisfaction.
47. How to analyze environmental trends with time series?
A: Studies time-dependent data to identify environmental trends.
Analyzing environmental trends involves collecting time-series data such as temperature, pollution levels, or wildlife populations.
Visualize the data using line charts to identify long-term trends and seasonal patterns.
Apply statistical tests to check for significant changes or anomalies over time.
Use time-series models like ARIMA or exponential smoothing to forecast future environmental conditions, supporting proactive policy decisions.
48. How to analyze price elasticity using regression?
A: Models how quantity demanded responds to price changes.
Price elasticity analysis starts with collecting data on prices and sales quantities.
Use scatter plots and correlation analysis to explore the relationship between price changes and demand.
Fit a regression model where price is the independent variable and demand is the dependent variable.
Interpret the regression coefficients to determine elasticity, which quantifies how sensitive demand is to price changes.
Use this information to optimize pricing strategies.
49. How to use multivariate regression in education?
A: Analyze multiple factors to understand educational outcomes.
Using multivariate regression in education involves collecting data on student performance and various influencing factors like attendance, study hours, and socio-economic background.
Explore the data to identify potential predictors.
Fit a multivariate regression model with performance as the outcome variable and other factors as predictors.
Analyze the coefficients to determine which factors have significant effects on educational outcomes, guiding targeted interventions.
50. How do we test user engagement with A/B testing?
A: Compares two variants before and after changes to assess impact.
A/B testing for user engagement involves defining a metric such as click-through rate or session duration.
Split users into two groups: a control group that sees the current version and a test group that sees the variant.
Run both versions concurrently, collecting data on engagement metrics.
Analyze the data using statistical tests to assess whether the new variant leads to significant improvements.
Use these findings to make informed decisions on user experience changes.
Get the high-quality PDF of the cheat sheet hereData Analysis Tips – Excel
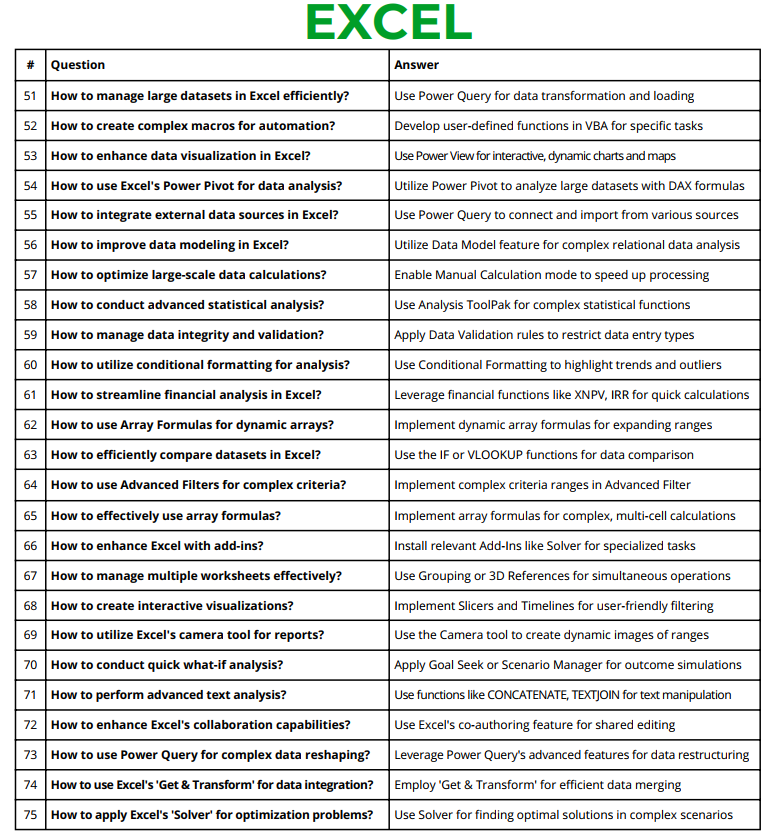
51. How do you manage large datasets in Excel efficiently?
A: Use Power Query for data transformation and loading.
Managing large datasets in Excel efficiently involves using Power Query to handle data transformation and loading.
Begin by importing the data into Power Query, which allows you to clean, filter, and transform the data without affecting Excel’s performance.
Use Power Query’s interface to merge, append, or filter large datasets quickly.
Once transformed, load the cleaned data back into Excel as a connection or a table, minimizing memory usage and improving overall performance.
52. How do you create complex macros for automation?
A: Develop user-defined functions in VBA for specific tasks.
Creating complex macros involves using VBA (Visual Basic for Applications) in Excel.
Open the VBA editor from the Developer tab and start writing scripts that automate repetitive tasks or create user-defined functions tailored to your needs.
Use VBA to automate processes like data entry, formatting, or running complex calculations.
Test your macro by running it within the editor, and make adjustments as needed to ensure it performs the desired task efficiently.
53. How to enhance data visualization in Excel?
A: Use Power View for interactive, dynamic charts and maps.
To enhance data visualization in Excel, utilize Power View, a feature that allows you to create interactive and dynamic charts, graphs, and maps.
Import your data into Power View, and use its drag-and-drop interface to design visualizations that update automatically when the underlying data changes.
Customize charts by adding slicers and filters, enabling users to explore the data interactively.
Power View is particularly useful for creating dashboards and presentations that require dynamic data visualizations.
54. How to use Excel’s Power Pivot for data analysis?
A: Utilize Power Pivot to analyze large datasets with DAX formulas.
Power Pivot is a powerful Excel add-in that allows you to work with large datasets and perform complex data analysis using DAX (Data Analysis Expressions) formulas.
Import data from multiple sources into Power Pivot, creating a data model that supports advanced calculations and relationships.
Use DAX formulas to perform calculations such as aggregations, rankings, or time intelligence functions.
Power Pivot enables you to analyze millions of rows without the performance limitations of regular Excel worksheets.
55. How to integrate external data sources in Excel?
A: Use Power Query to connect and import from various sources.
Integrating external data sources in Excel is simplified using Power Query, which connects to databases, web data, text files, and more.
Open Power Query, select the appropriate data source, and configure the connection settings.
Power Query allows you to import, transform, and combine data from different sources into a single Excel workbook.
This integration enables seamless data updates and merges, improving your data analysis capabilities.
56. How to improve data modeling in Excel?
A: Utilize the Data Model feature for complex relational data analysis.
Excel’s Data Model feature allows you to build relationships between tables, creating a powerful database-like environment within Excel.
Use the Data Model to combine data from multiple tables and perform calculations using Power Pivot.
Establish relationships by linking tables on common fields, and use these connections in PivotTables to perform complex data analysis.
The Data Model enables you to analyze large datasets in a structured and efficient manner.
57. How to optimize large-scale data calculations?
A: Enable Manual Calculation mode to speed up processing.
Optimizing large-scale calculations in Excel involves enabling Manual Calculation mode, which prevents Excel from automatically recalculating formulas until you manually trigger it.
Go to Excel Options, select Formulas, and switch to Manual Calculation.
This setting is particularly useful when working with large datasets or complex formulas, as it reduces processing time by allowing you to control when recalculations occur, thus speeding up your workflow.
58. How to conduct advanced statistical analysis?
A: Use Analysis ToolPak for complex statistical functions.
The Analysis ToolPak is an Excel add-in that provides advanced statistical analysis tools, such as regression, ANOVA, and correlation.
Enable the ToolPak through Excel Options under Add-Ins, then access the statistical functions from the Data tab.
Select the appropriate analysis tool, input your data, and configure the settings to perform the desired statistical test.
The Analysis ToolPak simplifies the process of conducting complex statistical analyses directly within Excel.
59. How to manage data integrity and validation?
A: Apply Data Validation rules to restrict data entry types.
To manage data integrity in Excel, use Data Validation to enforce rules on what can be entered into cells.
Go to the Data tab, select Data Validation, and set criteria such as allowing only numbers, dates within a range, or specific text formats.
Data Validation helps prevent errors by restricting invalid inputs and providing prompts to guide correct data entry, thereby maintaining the accuracy and reliability of your datasets.
60. How to utilize conditional formatting for analysis?
A: Use Conditional Formatting to highlight trends and outliers.
Conditional Formatting in Excel is a powerful tool for visually analyzing data by applying formats based on specific criteria.
Select the cells you want to format, go to the Home tab, and choose Conditional Formatting.
Set rules to highlight values that meet certain conditions, such as the top 10%, below average, or specific text.
This feature helps you quickly identify trends, outliers, and key insights in your data, making it easier to interpret large datasets.
61. How to streamline financial analysis in Excel?
A: Leverage financial functions like XNPV, IRR for quick calculations.
Streamlining financial analysis in Excel involves using built-in financial functions such as XNPV (Net Present Value) and IRR (Internal Rate of Return).
These functions are designed to perform complex financial calculations quickly and accurately.
Input your cash flows and discount rates into these functions to calculate key financial metrics, aiding in decision-making for investments, project evaluations, and financial planning.
62. How to use Array Formulas for dynamic arrays?
A: Implement dynamic array formulas for expanding ranges.
Array Formulas in Excel allow you to perform calculations on multiple cells simultaneously, producing results that automatically expand to fit the size of the data range.
Enter the formula using curly braces {} or use newer dynamic array functions like SEQUENCE or FILTER.
These formulas update automatically when data changes, making them ideal for dynamic reports and analyses that require real-time updates without manual adjustments.
63. How to efficiently compare datasets in Excel?
A: Use the IF or VLOOKUP functions for data comparison.
Comparing datasets in Excel can be efficiently done using functions like IF, VLOOKUP, or XLOOKUP.
Use IF to set conditions that compare data from two different sources or tables, highlighting differences or matches.
VLOOKUP allows you to search for specific data in one table and compare it against another, returning relevant results.
These functions streamline the comparison process, making it easy to identify discrepancies or validate data integrity.
64. How to use Advanced Filters for complex criteria?
A: Implement complex criteria ranges in Advanced Filter.
Advanced Filters in Excel enable you to filter data based on complex criteria beyond simple conditions.
Set up your criteria range with specific rules for filtering, then apply the Advanced Filter from the Data tab.
This tool allows you to extract subsets of data that match multiple conditions, copy the results to another location, and perform in-depth analysis with a focused dataset.
65. How to effectively use array formulas?
A: Implement array formulas for complex, multi-cell calculations.
Array Formulas are used in Excel to perform calculations across multiple cells, handling complex tasks such as summing, multiplying, or performing logical tests on arrays of data.
Enter an array formula by pressing Ctrl + Shift + Enter after typing the formula, which creates a dynamic array that automatically updates as data changes.
This approach simplifies multi-step calculations and reduces the need for additional helper columns.
66. How to enhance Excel with add-ins?
A: Install relevant Add-Ins like Solver for specialized tasks.
Enhancing Excel’s capabilities involves installing add-ins that provide additional functionality tailored to specific tasks. Go to Excel Options, select Add-Ins, and install tools like Solver for optimization, Power Query for data integration, or Analysis ToolPak for statistical analysis. These add-ins expand Excel’s toolset, allowing you to perform more sophisticated analyses directly within the software.
67. How do you manage multiple worksheets effectively?
A: Use Grouping or 3D References for simultaneous operations.
Managing multiple worksheets in Excel can be streamlined by grouping sheets to perform actions on several sheets at once.
Hold Ctrl and click the tabs of the sheets you want to group, allowing you to enter data, format, or perform calculations across all selected sheets simultaneously.
Additionally, 3D references in formulas can be used to calculate data across multiple sheets, enhancing efficiency when working with large, multi-sheet workbooks.
68. How do you create interactive visualizations?
A: Implement Slicers and Timelines for user-friendly filtering.
Creating interactive visualizations in Excel is made easy with Slicers and Timelines, which act as interactive filters for PivotTables and PivotCharts.
Add Slicers to your report to enable quick filtering by categories, and use Timelines to filter date ranges interactively.
These tools enhance the user experience, making data exploration intuitive and allowing stakeholders to view the data from various perspectives quickly.
69. How do you utilize Excel’s camera tool for reports?
A: Use the Camera tool to create dynamic images of ranges.
The Camera tool in Excel allows you to create snapshots of data ranges that update automatically when the source data changes.
Add the Camera tool to your Quick Access Toolbar, select the range you want to capture, and insert the live image into your report.
This feature is useful for creating dashboards and presentations where data needs to stay current without manual updates.
70. How to conduct a quick what-if analysis?
A: Apply Goal Seek or Scenario Manager for outcome simulations.
Quick what-if analysis in Excel can be conducted using Goal Seek or Scenario Manager.
Use Goal Seek to find the input value needed to achieve a desired result by adjusting one variable at a time.
Scenario Manager allows you to compare multiple scenarios by changing various inputs simultaneously, helping you visualize the impact of different assumptions on your outcomes.
71. How to perform advanced text analysis?
A: Use functions like CONCATENATE, TEXTJOIN for text manipulation.
Performing advanced text analysis in Excel involves using functions such as CONCATENATE, TEXTJOIN, and MID to manipulate and analyze text strings.
These functions allow you to merge text from multiple cells, extract specific characters, or reformat data for analysis.
Combine them to perform complex text operations, such as creating custom reports or cleaning data for further processing.
72. How to enhance Excel’s collaboration capabilities?
A: Use Excel’s co-authoring feature for shared editing.
Excel’s collaboration capabilities are enhanced by using the co-authoring feature, which allows multiple users to work on the same workbook simultaneously.
Save the workbook to OneDrive or SharePoint, and share it with colleagues, enabling real-time updates and edits.
This feature improves teamwork and reduces version conflicts, making Excel a powerful tool for collaborative projects.
73. How to use Power Query for complex data reshaping?
A: Leverage Power Query’s advanced features for data restructuring.
Power Query is a versatile tool in Excel for reshaping and cleaning data.
Use Power Query to transform data by pivoting, unpivoting, merging, and splitting columns, allowing you to restructure complex datasets into usable formats.
Apply custom transformations using M language for advanced data reshaping tasks, making Power Query an essential tool for complex data manipulation.
74. How to use Excel’s ‘Get & Transform’ for data integration?
A: Employ ‘Get & Transform’ for efficient data merging.
Excel’s ‘Get & Transform’ feature, powered by Power Query, facilitates data integration by allowing you to connect, combine, and transform data from various sources.
Use ‘Get & Transform’ to pull data from databases, text files, or web sources, and merge them into a single dataset.
This tool automates the data import process, streamlining data integration tasks and reducing manual work.
75. How to apply Excel’s ‘Solver’ for optimization problems?
A: Use Solver to find optimal solutions in complex scenarios.
Solver is an Excel add-in used for optimization problems where you need to maximize or minimize a target value subject to constraints.
Define your objective cell, input the variables to change, and set constraints in the Solver parameters.
Run Solver to find the optimal solution, whether it’s minimizing costs, maximizing profits, or finding the best allocation of resources within defined limits.
Get the high-quality PDF of the cheat sheet hereData Analysis Tips – Python
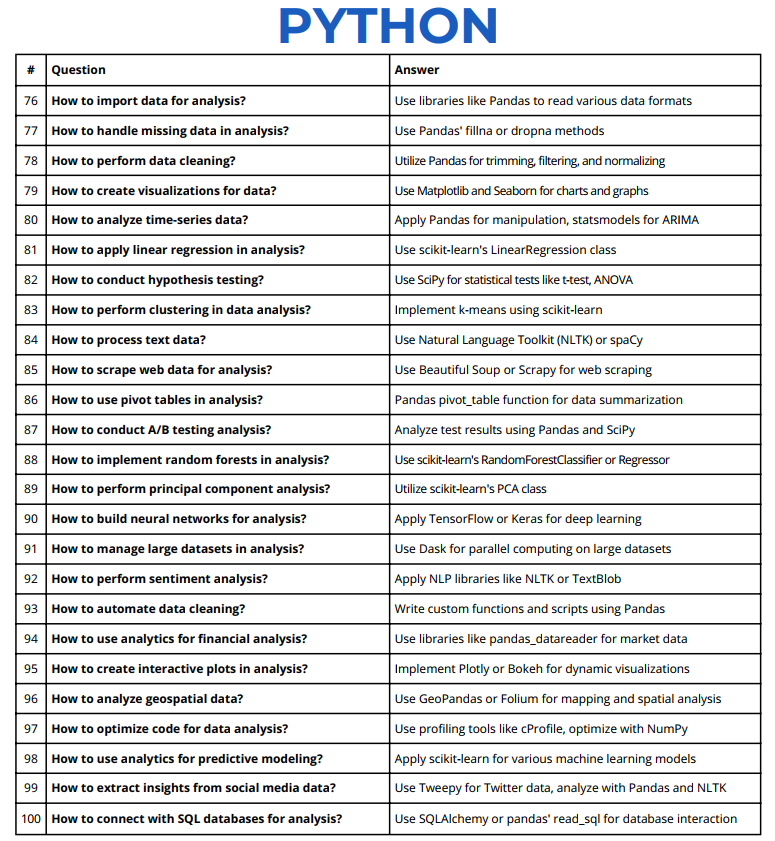
76. How to import data for analysis?
A: Use libraries like Pandas to read various data formats.
To import data for analysis in Python, use the Pandas library, which supports reading data from multiple formats such as CSV, Excel, SQL databases, JSON, and more.
Start by installing Pandas using pip, then use functions like pd.read_csv(), pd.read_excel(), or pd.read_sql() to load your data into a Pandas DataFrame.
Customize the import parameters to handle missing values, specify data types, or select specific columns, making data preparation more efficient for analysis.
77. How do you handle missing data in analysis?
A: Use Pandas’ fillna or dropna methods.
Handling missing data in Python is straightforward with Pandas’ fillna() and dropna() methods.
Use fillna() to replace missing values with a specified value, mean, median, or mode, ensuring consistency in your dataset.
Alternatively, use dropna() to remove rows or columns with missing values, depending on the nature of the analysis.
These functions help maintain data quality, reducing the impact of missing data on your models and analysis.
78. How to perform data cleaning?
A: Utilize Pandas for trimming, filtering, and normalizing.
Data cleaning in Python can be efficiently done using Pandas. Use methods like strip(), replace(), and apply() to trim whitespace, correct typos, and normalize text data.
Filter rows using conditions to remove unwanted data and apply functions like pd.to_numeric() to convert data types.
These steps ensure your data is clean and formatted correctly for further analysis, reducing errors in subsequent steps.
79. How do you create visualizations for data?
A: Use Matplotlib and Seaborn for charts and graphs.
Creating visualizations in Python involves using libraries like Matplotlib and Seaborn.
Start by importing these libraries and your dataset, then use Matplotlib’s plt.plot(), plt.bar(), or plt.hist() functions to create basic charts. S
eaborn provides more advanced and aesthetically pleasing options with functions like sns.lineplot(), sns.barplot(), and sns.heatmap().
Customize your plots with titles, labels, and color palettes to enhance data presentation and insights.
80. How to analyze time-series data?
A: Apply Pandas for manipulation, statsmodels for ARIMA.
Time-series analysis in Python typically involves Pandas for data manipulation and Statsmodels for modeling.
Load your time-series data into a Pandas DataFrame, then use Pandas functions like resample() and rolling() to aggregate and smooth data.
For forecasting, use Statsmodels’ ARIMA or SARIMA models by fitting the data and validating the model’s performance.
These steps enable effective analysis of time-dependent data to identify trends and make predictions.
81. How to apply linear regression in analysis?
A: Use scikit-learn’s LinearRegression class.
Linear regression in Python can be performed using the scikit-learn library.
Import LinearRegression from scikit-learn, then split your dataset into training and testing sets.
Fit the LinearRegression model on the training data using predictor and response variables, and evaluate the model’s performance on the test set using metrics like R-squared.
Use the model to understand the relationships between variables and make predictions based on new data.
82. How to conduct hypothesis testing?
A: Use SciPy for statistical tests like t-test, ANOVA.
Hypothesis testing in Python is conducted using the SciPy library, which offers a variety of statistical tests like t-tests, ANOVA, and chi-square tests.
Import the relevant functions from SciPy, such as ttest_ind() or f_oneway(), and input your data samples.
Analyze the test results by interpreting the p-values to determine statistical significance, helping to validate or reject hypotheses based on the data.
83. How can you perform clustering in data analysis?
A: Implement k-means using scikit-learn.
Clustering in Python can be done using scikit-learn’s KMeans algorithm.
Import KMeans from scikit-learn, preprocess your data by scaling it with StandardScaler, and decide the number of clusters using the elbow method.
Fit the KMeans model to your data, then interpret the cluster centers and labels to understand how your data is grouped.
Clustering helps uncover patterns and segments within your dataset.
84. How to process text data?
A: Use Natural Language Toolkit (NLTK) or spaCy.
Processing text data in Python is facilitated by libraries like NLTK and spaCy.
Use NLTK for tasks like tokenization, stop word removal, and stemming to break down and clean text data.
Alternatively, use spaCy for advanced NLP tasks such as part-of-speech tagging, named entity recognition, and text vectorization.
These tools help prepare text data for further analysis, such as sentiment analysis or text classification.
85. How to scrape web data for analysis?
A: Use Beautiful Soup or Scrapy for web scraping.
Web scraping in Python can be achieved using Beautiful Soup and Scrapy.
Beautiful Soup is used to parse HTML and XML documents, allowing you to extract data from web pages.
Scrapy is a more advanced framework that enables you to build spiders to crawl websites and extract large volumes of data automatically.
Both tools require careful handling of website permissions and ethical considerations when scraping data for analysis.
86. How to use pivot tables in analysis?
A: Pandas pivot_table function for data summarization.
Pivot tables in Python can be created using the Pandas pivot_table() function, which allows you to summarize, aggregate, and reshape data similar to Excel’s pivot tables.
Load your data into a Pandas DataFrame, then use pivot_table() to group data by specified categories and perform calculations like sum, average, or count.
This function enhances data analysis by providing a clear summary of complex datasets.
87. How to conduct A/B testing analysis?
A: Analyze test results using Pandas and SciPy.
To conduct A/B testing analysis in Python, collect data from the test and control groups, then use Pandas to organize and summarize the results.
Use SciPy’s statistical functions, such as ttest_ind(), to compare the outcomes of the two groups.
Analyze the p-value to determine if the observed differences are statistically significant, helping you make data-driven decisions on which variant performs better.
88. How do you implement random forests in analysis?
A: Use scikit-learn’s RandomForestClassifier or Regressor.
Implementing random forests in Python involves using scikit-learn’s RandomForestClassifier for classification tasks or RandomForestRegressor for regression.
Load and preprocess your data, then split it into training and testing sets.
Train the random forest model on the training set and evaluate its accuracy or performance on the test set using metrics like accuracy, precision, or mean squared error.
Random forests are robust models that handle complex data structures and interactions.
89. How to perform the principal component analysis?
A: Utilize scikit-learn’s PCA class.
PCA can be performed in Python using scikit-learn’s PCA class.
Load your data and standardize it to ensure all features contribute equally to the analysis.
Fit the PCA model to your data to reduce its dimensionality while preserving the most variance.
Analyze the principal components to identify key factors, and visualize the results with scree plots or biplots.
PCA simplifies complex datasets, making them easier to interpret and analyze.
90. How to build neural networks for analysis?
A: Apply TensorFlow or Keras for deep learning.
Building neural networks in Python is facilitated by frameworks like TensorFlow and Keras.
Define the architecture of your neural network, including the input, hidden, and output layers.
Compile the model by specifying the optimizer, loss function, and metrics, then train it using your dataset.
Evaluate the model’s performance and adjust the architecture or hyperparameters as needed.
Neural networks are powerful for analyzing complex data patterns and making predictions.
91. How do you manage large datasets in analysis?
A: Use Dask for parallel computing on large datasets.
Managing large datasets in Python can be done using Dask, which allows parallel computing on large data structures that don’t fit into memory.
Load your data into Dask DataFrames, which operate similarly to Pandas but enable computations to be distributed across multiple cores or machines.
Dask optimizes performance by breaking down large tasks into smaller, manageable pieces, making it ideal for big data analysis.
92. How to perform sentiment analysis?
A: Apply NLP libraries like NLTK or TextBlob.
Sentiment analysis in Python is performed using NLP libraries such as NLTK and TextBlob.
Use NLTK to preprocess text data by tokenizing and cleaning, then apply TextBlob to analyze the sentiment, categorizing the text as positive, negative, or neutral.
Alternatively, use advanced models like BERT for more nuanced sentiment analysis. These tools help gauge public opinion or customer feedback effectively.
93. How to automate data cleaning?
A: Write custom functions and scripts using Pandas.
Automating data cleaning in Python can be achieved by writing custom functions using Pandas.
Define functions to handle common tasks like removing duplicates, correcting formatting, and handling missing values.
These functions are used in a cleaning pipeline that processes the data automatically, reducing manual intervention and improving consistency.
Automation speeds up the data preparation phase, making your workflow more efficient.
94. How to use analytics for financial analysis?
A: Use libraries like pandas_datareader for market data.
Financial analysis in Python involves using libraries like pandas_datareader to pull market data directly from financial sources such as Yahoo Finance or Alpha Vantage.
Load the data into a Pandas DataFrame, then perform calculations such as moving averages, returns, or volatility analysis.
These analytics help in making investment decisions and evaluating financial performance.
95. How to create interactive plots in analysis?
A: Implement Plotly or Bokeh for dynamic visualizations.
Interactive plots in Python can be created using Plotly or Bokeh, which allows for the creation of dynamic, interactive charts.
Import your data and use Plotly’s go.Figure() or Bokeh’s plotting functions to build interactive line charts, bar plots, or scatter plots.
Customize the interactivity with hover, zoom, and filter options, making your visualizations more engaging and informative for end-users.
96. How to analyze geospatial data?
A: Use GeoPandas or Folium for mapping and spatial analysis.
Analyzing geospatial data in Python involves using GeoPandas for data manipulation and Folium for creating interactive maps.
Load your spatial data into GeoPandas, perform operations like spatial joins, and visualize results.
Use Folium to create interactive maps, adding layers and markers to highlight specific areas of interest. These tools allow you to conduct spatial analysis and visualize geographic patterns effectively.
97. How to optimize code for data analysis?
A: Use profiling tools like cProfile, optimize with NumPy.
Optimizing code for data analysis in Python starts with using profiling tools like cProfile to identify bottlenecks in your code.
Analyze the performance results and refactor the slow sections, replacing loops with vectorized operations using NumPy.
Efficient code reduces execution time and improves the overall performance of data analysis workflows, especially when dealing with large datasets.
98. How to use analytics for predictive modeling?
A: Apply scikit-learn for various machine learning models.
Predictive modeling in Python is facilitated by scikit-learn, which provides a range of machine learning algorithms like decision trees, SVM, and linear regression.
Load your data, preprocess it, and split it into training and testing sets.
Choose an appropriate model, fit it into the training data, and evaluate its performance using testing data. Fine-tune the model’s parameters to improve accuracy and deploy it for making future predictions.
99. How do you extract insights from social media data?
A: Use Tweepy for Twitter data, analyze with Pandas and NLTK.
Extracting insights from social media data involves using Tweepy to connect to the Twitter API and collect tweets based on keywords, hashtags, or user mentions.
Load the data into Pandas for cleaning and organization, then apply NLTK or TextBlob for sentiment analysis or keyword extraction.
Analyzing this data provides valuable insights into public sentiment, trends, and customer feedback.
100. How to connect with SQL databases for analysis?
A: Use SQLAlchemy or pandas’ read_sql for database interaction.
Connecting to SQL databases in Python is achieved using SQLAlchemy or Pandas’ read_sql() function.
Use SQLAlchemy to establish a connection with your database and write SQL queries directly within Python scripts.
Alternatively, use read_sql() to pull data into Pandas DataFrames for analysis.
This integration allows for seamless interaction between Python and databases, enabling efficient data retrieval and manipulation for analysis.
Get the high-quality PDF of the cheat sheet here4 Types of Data Analysis
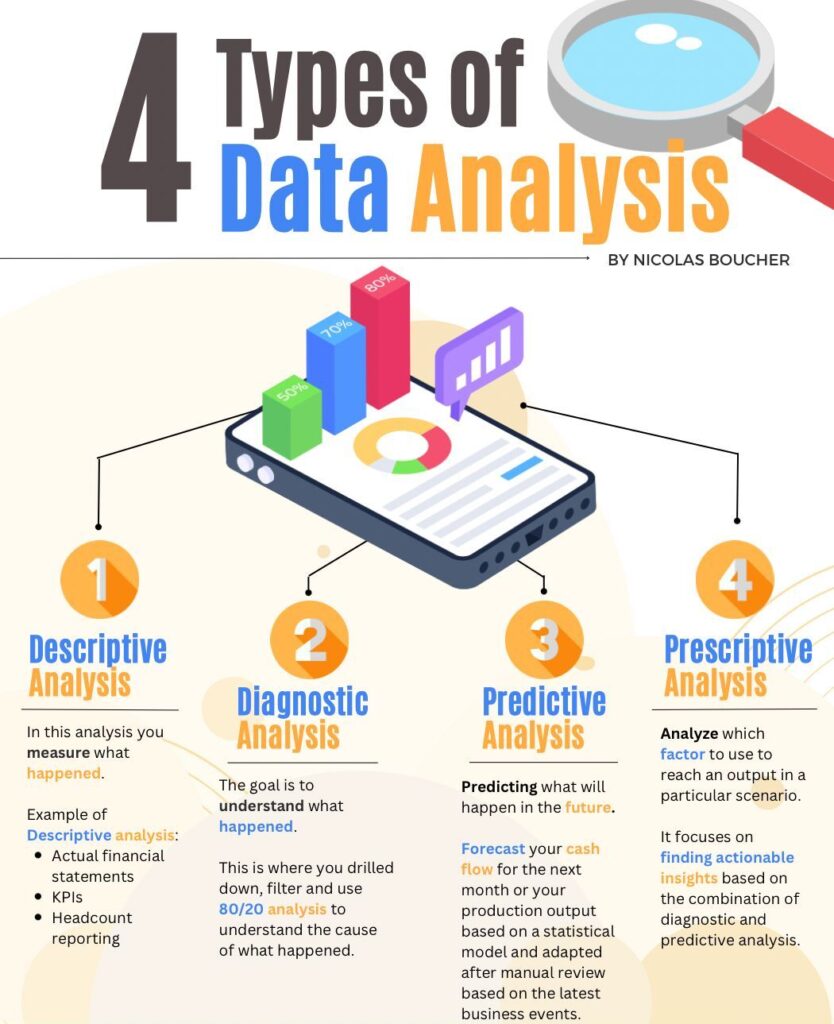
#1: Descriptive Analysis
Descriptive analysis helps you understand what has happened by providing a clear overview of the current situation without interpretation.
To get the most out of it, start by defining what you want to learn and identify the data you need.
Focus on gathering accurate and complete data, and present your findings in clear, straightforward language.
Highlight any trends, patterns, or anomalies to give a full picture.
Examples:
- Actual vs. Budget Financial Statements: Comparing actual financial results with the budget to identify variances in revenue, expenses, and profitability, helping finance teams assess financial performance.
- KPI Reporting: Tracking key performance indicators like EBITDA, cash flow, and working capital to provide a snapshot of the company’s financial health.
- Headcount and Payroll Reporting: Summarizing headcount, payroll costs, and departmental allocations to manage labor expenses and align with financial plans.
- Expense Analysis: Reviewing and categorizing business expenses to monitor cost control and identify areas for potential savings.
How to Start a Descriptive Analysis:
- Define the key metrics and KPIs you want to measure.
- Gather data related to these metrics.
- Use basic statistical techniques like mean, median, and mode.
- Visualize data using charts and graphs to communicate the results clearly.
#2: Diagnostic Analysis
Diagnostic analysis goes deeper to find out why something happened.
It involves drilling down, filtering data, and using 80/20 analysis to identify the root causes.
Use clear language to present your findings and highlight key patterns or trends.
Cross-check your results with other sources and get feedback to ensure accuracy.
Examples:
- Variance Analysis of Budget vs. Actuals: Investigating why actual financial performance deviated from the budget, identifying root causes such as changes in sales volume, price variations, or unexpected expenses.
- Cash Flow Analysis: Drilling into cash flow statements to understand factors contributing to cash shortages or surpluses, such as changes in receivables, payables, or inventory levels.
- Revenue Mix Analysis: Analyzing changes in revenue composition, such as shifts between products, services, or customer segments, to understand what is driving performance.
- Cost Driver Analysis: Examining the underlying drivers of cost increases, such as higher material costs or overtime, to implement corrective actions.
How to Start a Diagnostic Analysis:
- Define the problem you want to understand.
- Gather and analyze data related to the issue.
- Use techniques like regression and correlation analysis to explore relationships.
- Use 80/20 analysis and drill-down techniques to pinpoint causes.
#3: Predictive Analysis
Predictive analysis forecasts what is likely to happen using statistical models.
This could involve predicting next month’s cash flow or estimating production output, adjusted based on recent business events.
Define what you want to predict and gather relevant data.
Use various forecasting techniques, validate results by cross-checking with other sources, and clearly communicate assumptions and uncertainties.
Examples:
- Financial Forecasting: Predicting future financial performance, such as revenue, expenses, and cash flow, using historical data to support strategic planning and decision-making.
- Working Capital Forecasting: Estimating future working capital needs to ensure sufficient liquidity for operations, factoring in expected changes in receivables, payables, and inventory.
- Credit Risk Analysis: Predicting the likelihood of bad debt by analyzing customer payment patterns and financial health to adjust credit terms and manage risk.
- CapEx Forecasting: Forecasting capital expenditures based on historical spending patterns and planned investments to manage cash flow and budget requirements.
How to Build Predictive Analysis:
- Define the future event or outcome you want to predict.
- Collect historical data related to it.
- Apply models like regression, time series, or machine learning.
- Validate predictions and refine models as needed.
#4: Prescriptive Analysis
Prescriptive analysis recommends actions to achieve specific outcomes, combining insights from diagnostic and predictive analyses.
Define the outcome you want, gather the necessary data, and use techniques like simulation and optimization to find the best approach.
Communicate your findings clearly and be ready to adjust based on feedback and new information.
Examples:
- Optimizing Capital Allocation: Using data to determine the best way to allocate capital across projects, focusing on maximizing returns while managing risk and maintaining liquidity.
- Cost Reduction Strategies: Analyzing operational data to prescribe cost-cutting measures that align with business strategy, such as renegotiating supplier contracts or streamlining processes.
- Investment Decision Modeling: Creating models that suggest the most profitable investment opportunities based on projected cash flows, ROI, and risk assessments.
- Scenario Analysis for Strategic Planning: Prescribing actions based on different financial scenarios, such as best, worst, and most likely cases, to prepare for various economic conditions.
How to Model Prescriptive Analysis:
- Optimizing Capital Allocation: Using data to determine the best way to allocate capital across projects, focusing on maximizing returns while managing risk and maintaining liquidity.
- Cost Reduction Strategies: Analyzing operational data to prescribe cost-cutting measures that align with business strategy, such as renegotiating supplier contracts or streamlining processes.
- Investment Decision Modeling: Creating models that suggest the most profitable investment opportunities based on projected cash flows, ROI, and risk assessments.
- Scenario Analysis for Strategic Planning: Prescribing actions based on different financial scenarios, such as best, worst, and most likely cases, to prepare for various economic conditions.
Final Words
Data analysis doesn’t have to feel like an endless cycle of spreadsheets and formulas.
You can turn complex data into clear insights that drive real results with the right approach.
This cheat sheet isn’t just a list of tips; it’s your toolkit for making data analysis faster, smarter, and more impactful.
Using these data analysis tips will not only sharpen your analytical skills but also empower your finance team to make decisions that move the needle.
Download your copy today and start turning data into your competitive advantageFAQ
Q: Who is this cheat sheet for?
A: This cheat sheet is designed for finance professionals working in corporate finance roles, particularly those under the CFO or within finance teams. It’s a practical guide for anyone looking to enhance their data analysis skills and make more informed financial decisions.
Q: What types of analysis are covered in the cheat sheet?
A: The cheat sheet covers descriptive, diagnostic, predictive, and prescriptive analyses. It provides tips on how to approach each type, including real-world examples relevant to finance professionals.
Q: Do I need advanced technical skills to use these tips?
A: No, the tips are designed for all levels, from beginners to experienced professionals. While some techniques involve tools like Excel or Python, the cheat sheet includes step-by-step guidance to help you get started, regardless of your technical background.
Q: How can these tips help me save time on data analysis?
A: The tips focus on practical methods to simplify and speed up the analysis process. You’ll learn how to use the right tools, avoid common pitfalls, and focus on key insights that drive better decision-making, saving you time and effort.
Q: How do I get my copy of the 100 Data Analysis Tips cheat sheet?
A: You can claim your free copy by clicking here. It’s available in a high-quality PDF format, perfect for quick reference and easy sharing with your team.