Imagine finishing your monthly close with hours to spare. Instead of wrestling with spreadsheets, you’re crafting insightful narratives, exploring new growth scenarios, or advising the executive team on critical decisions.
The friction and tedium of manual data management recede into the background, replaced by streamlined workflows and automated processes that practically run themselves.
This isn’t a far-off fantasy—it’s the reality for finance professionals who embrace Python and Generative AI.
For seasoned finance professionals such as CFOs, directors, and controllers, the core challenge often lies not in the complexity of financial concepts but in the sheer volume of repetitive, mechanical tasks.
While Excel has served as the backbone for decades, it struggles when data becomes massive and dynamic or when nuanced analytics require more than built-in pivot tables can deliver.
Python, enhanced by AI-driven tools, can step in to handle these complexities, empowering you to focus on high-level strategy and forward-looking analysis rather than day-to-day grunt work.
Table of Contents
Why Python and AI Are Your Next Power Tools
Finance professionals have traditionally relied on tools like Excel, ERP systems, and BI platforms.
These tools are tried and tested but come with limitations when dealing with increasing complexity, evolving data sources, and the demand for real-time analytics.
Why Now?
- Data Explosion: Finance teams are no longer dealing with just monthly statements. You now have streaming data from ERP systems, CRMs, banks, and external market feeds. Excel can buckle under this load.
- Speed and Accuracy: Python, coupled with AI, allows you to set up scripts that run instantly, ensure data integrity, and reduce human error.
- Strategic Freedoms: Freeing yourself from routine chores means you can invest time in scenario planning, capital allocation strategies, and advising the executive team on big-picture decisions.
- Scalability and Customization: Python isn’t a one-size-fits-all tool—it’s fully customizable. Whether you need to integrate new data sources, run complex sensitivity analyses, or produce sophisticated dashboards, Python can do it all. Combine that with AI-driven code assistance (e.g., ChatGPT, Copilot, or Gemini) to speed up development and reduce friction.
Start small. If you spend two hours a week merging department-level budget files, try writing a Python script to merge them automatically.
Use an AI assistant to help you draft the code. You’ll see immediate ROI and build confidence for bigger projects.
10 Finance Tasks You Can Automate Right Now
To truly appreciate the power of Python and AI, consider how they apply to tasks you tackle every day. Think about something as fundamental as cleaning and consolidating files.
Instead of copying and pasting data into one master workbook, you can write a Python script—assisted by AI prompts—that systematically reads, cleans, and merges all your input files. What once felt like a chore now runs quietly in the background.
Or picture the complexity of forecasting. Rather than tinkering with Excel’s forecasting functions and updating cell references each month, Python can integrate with libraries that apply advanced models like ARIMA or Prophet to your historical data.
One prompt to the AI could yield a script that updates your revenue projections in real time, adjusting instantly when fresh data flows in.
Here are the 10 tasks you can automate:
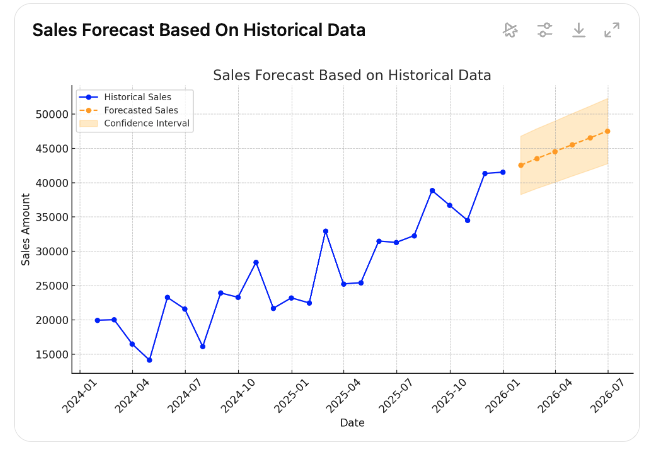
#1: Forecasting and Time Series Analysis
Use AI tools to generate a baseline forecast script. Then, refine parameters until you get consistently accurate predictions.
Why Python is better?
Python simplifies forecasting by integrating historical data, adjusting for seasonality, and automating updates as new data comes in.
Once the model is set up, Python recalculates forecasts in real time, making it far more flexible and powerful than Excel.
Example
A company looking to forecast future cash flows based on historical sales data can automate the process with Python.
The ability to adjust for seasonal trends or unpredictable changes makes Python especially useful for real-time business decision-making.
#2: Data Cleaning and Standardization
Convert messy, multi-format spreadsheets from multiple regional offices into a clean, standardized dataset ready for analysis.
Define a set of cleaning rules and let Python’s pandas library handle missing values, inconsistent date formats, and stray text fields.
Why Python is better?
Python allows you to automate data cleaning through pre-defined rules. You can standardize data formats, remove inconsistencies, and handle large datasets seamlessly.
This is especially helpful when dealing with transactions across multiple systems or departments.
#3: Complex Visualizations (e.g., Cohort Analysis)
Tip: Use matplotlib, seaborn, or plotly libraries. With AI help, you can generate the code for complex visualizations without deep technical know-how.
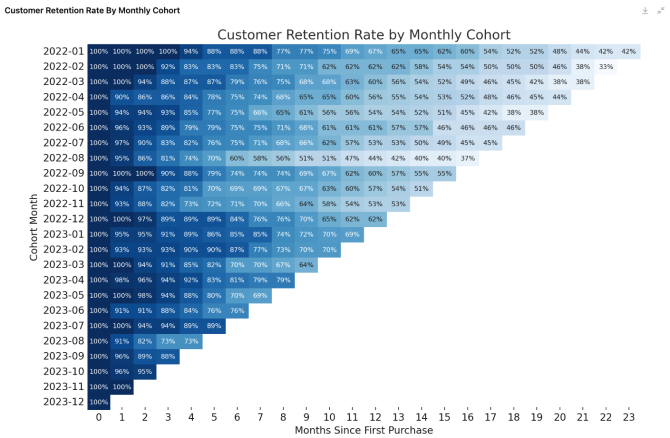
Imagine tracking customer revenue retention over time using cohort analysis.
With Python, this involves creating the cohorts once and then generating the visualizations effortlessly, allowing finance teams to focus on interpreting results rather than building charts.
Why Python is better?
Python streamlines the creation of complex graphs by automating both data preparation and visualization steps.
Once the data structure is set, generating these visuals becomes a dynamic and repeatable process.
Unlike Excel, where you need to manually format and update charts, Python handles this automatically.
Example
Imagine tracking customer revenue retention over time using cohort analysis.
With Python, this involves creating the cohorts once, then generating the visualizations effortlessly, allowing finance teams to focus on interpreting results rather than building charts.
#4: Consolidating Multiple Files
Merge monthly P&L files from 15 subsidiaries into a single workbook with one click.
Set up a Python script to open every file in a directory, standardize column names, and output a consolidated file. You’ll never open 15 separate spreadsheets again.
Why Python is better?
Python automates the entire process, enabling you to read multiple files, identify common fields, and merge them into a single dataset with ease.
Python efficiently handles large volumes of data from various formats (Excel, CSV, JSON), freeing you from repetitive work.
#5: Dynamic Cash Flow Projections
Update cash flow projections the moment new sales or expenses are recorded.
Integrate Python scripts with a scheduling tool (like cron or Windows Task Scheduler) to run nightly and email you a refreshed cash flow statement each morning.
Why Python is better?
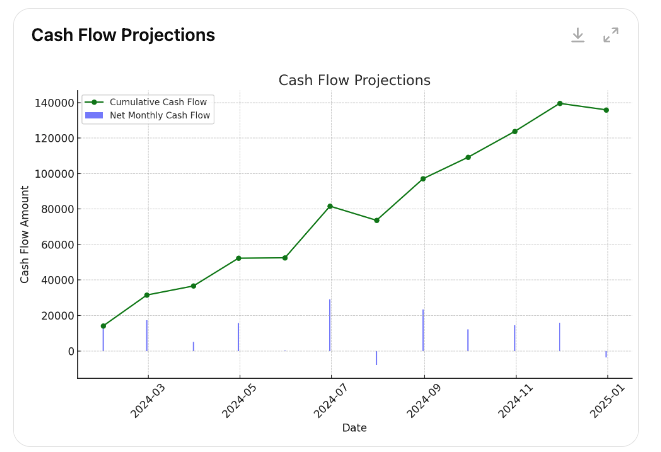
Python automates cash flow projections by integrating various data inputs (e.g., sales forecasts and payment schedules) and dynamically updating projections as conditions change.
It handles multiple scenarios without the manual reworking that Excel requires.
Example
A company can automatically generate monthly cash flow projections that adjust in real-time as new sales and expense data are received.
With Python, these projections can incorporate different assumptions, such as late payments or seasonal fluctuations, making it much more adaptable than Excel.
#6: Bank Reconciliations
You can cross-check thousands of bank transactions against internal ledgers in seconds.
Use Python’s data-frame merge operations to flag discrepancies automatically and send a report of mismatches to the accounting team.
Why Python is better?
Python automates the reconciliation process by comparing transactions between different datasets, quickly identifying mismatches, and flagging potential issues.
This eliminates the need for manual checks, which are slow and error-prone in Excel.
#7: Automate Scenario & Sensitivity Analysis
You can write a Python script that loops through scenarios, updates your models, and outputs a comparison table, complete with charts and narrative summaries generated by AI.
Why Python is better?
Python enables you to simulate hundreds of scenarios automatically, providing quick insights into how changes in key financial variables impact the company’s bottom line.
This allows for real-time analysis and decision-making.
Example
Imagine assessing how a 2% increase in interest rates would affect your company’s debt servicing costs.
Instead of manually adjusting numbers and recalculating, Python runs the simulations in seconds, producing detailed outputs for multiple interest rate scenarios.

#8: Expense Categorization
You can classify thousands of transactions by expense type using predefined rules or even a simple AI model.
Tip: Start with rule-based logic. Later, teach a machine learning model in Python to categorize expenses based on historical classifications.
Why Python is better?
Python automates categorizing transactions by applying predefined business rules.
It can also reconcile discrepancies faster and more accurately than Excel, reducing manual labor and improving efficiency.
#9: Risk Modeling & Monte Carlo Simulations
Python libraries like numpy and scipy make simulation simple. AI tools can help write initial code and explain each step.
Why Python is better?
Python automates running complex risk models and simulates potential outcomes based on multiple factors. It’s ideal for running large-scale simulations, which would be difficult to manage in Excel due to its limited processing power.
Example
A finance team might use Python to simulate the potential impact of fluctuating market conditions on a portfolio of investments.
This analysis, which could take hours to set up in Excel, can be performed quickly and repeatedly with Python.

#10: Automated Data Fetching
You can pull real-time foreign exchange rates or stock prices via an API and integrate these into your models without manual data entry.
Leverage Python’s requests library to fetch API data. AI assistants can help troubleshoot authentication and formatting issues.
Why Python is better?
Python automates data fetching from various APIs or databases, integrating real-time data directly into financial models.
It eliminates the need for manual updates and ensures your analysis is always based on the latest data.
As you gradually incorporate Python and AI into tasks like expense categorization, multi-file consolidation, and complex reporting, you’ll notice a pattern: each automation adds a layer of reliability and frees you to focus on higher-level thinking.
You’re no longer in the weeds; you’re on higher ground, surveying the landscape.
Your Path to Mastering AI and Python for Finance
Embracing AI and Python doesn’t mean you need to become a full-time software engineer. Instead, you’re layering new capabilities onto your existing expertise.
Stage 1: Curiosity to Action

Start by using ChatGPT or Bard to handle small tasks like summarizing a PDF or generating a first draft of a memo.
Keep track of tasks where you feel stuck, then try: “My job is X, I want to do Y. ChatGPT, can you draft a Python script to achieve this?” Even if 20% works, that’s a big head start.
Stage 2: Structured Prompting
Adopt prompting frameworks like CSI+FBI (Context, Specific, Instruction + Format, Blueprint, Identity) for consistent results.
Example: Instead of “Give me a Python script,” say: “Context: I am a CFO consolidating monthly reports. Specific: I need code to merge CSV files. Instruction: Write a Python script using pandas. Format: Provide code snippet with comments. Blueprint: Base it on merging three CSV files. Identity: You are a finance coding coach.”
Stage 3: Prompt Engineering
Master techniques like “chain-of-thought” prompting, which encourages AI to break down problems step-by-step.
Chunk large tasks into smaller steps: first clean data, then calculate KPIs, then visualize results.
Learn how to ask AI agents to reason through complex problems rather than just giving final answers.
Stage 4: Integrating Python
Install Python and get comfortable with pandas. Use AI to help you fix errors quickly.
Pair simple Python scripts with AI prompting. If something breaks, copy the error into ChatGPT: “Here’s my error, how do I fix it?”
Stage 5: Full Customization and Deployment
Connect Python scripts to confidential company data in secure environments (like Azure or AWS).
Customize AI models for your use cases. For example, use private large language models fine-tuned on your industry’s financial reports.
Create end-to-end workflows: Python pulls data, AI analyzes it, Python outputs a dashboard, AI generates narrative summaries. You’re no longer just automating; you’re innovating.
The Path to Python Proficiency
If you’re new to programming, start with the fundamentals in an environment like Google Colab or Jupyter Notebook.
Load a sample CSV file and see if you can filter certain rows, calculate sums, or group data by category.
If something goes wrong, copy the error message and ask your AI assistant for help.
By doing this, you learn not just how to solve a single issue, but how to handle future challenges more confidently.
As you get comfortable, introduce visualizations.
Instead of static charts that require manual updates, Python allows you to generate sophisticated plots that refresh automatically as new data arrives.
With a single script, you can create correlation heatmaps, cohort analyses, and dashboards that pull in daily KPIs.
The more you do, the more you’ll realize Python’s immense capability to transform your reporting process.
Further down this path lies automation at scale.
Perhaps you set up a script that fetches exchange rates from an API every morning, updates your currency conversion tables, and sends you a daily summary.
Or maybe you build a model that forecasts sales based on historical data, clustering algorithms, and external indicators.
As you progress, you’ll incorporate machine learning techniques, experiment with advanced forecasting models, and even integrate your Python scripts with other enterprise systems.
Eventually, Python becomes more than just another tool.
It becomes a medium through which you create value and guide strategic decisions.
By the time you’ve mastered these advanced techniques, you won’t just be adopting the latest technologies—you’ll be shaping your team’s future, setting the standard for what’s possible in finance analytics.
Here is your path to proficiency simplified:
Phase 1: Basics
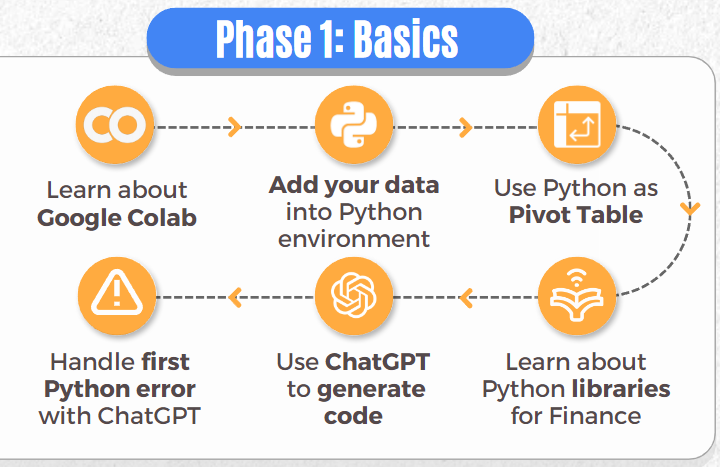
Start in Google Colab or Jupyter Notebook. Learn to load CSV files, filter rows, and perform aggregate calculations. Use ChatGPT to troubleshoot errors.
Take one of your Excel reports and replicate the pivot table operations in Python. Once comfortable, you’ll never look back.
Phase 2: Visualization
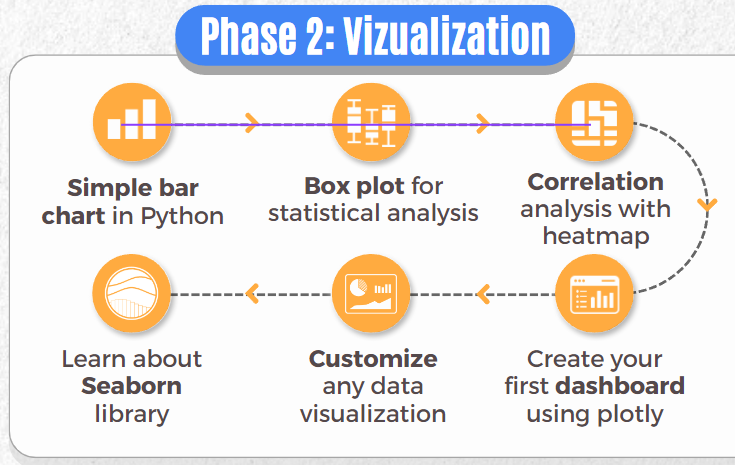
Use the Python libraries: matplotlib, seaborn, plotly. Replace static Excel charts with dynamic Python dashboards.
Update charts automatically whenever data changes. Ask AI to generate code for a correlation heatmap.
Tweak colors and labels for immediate professional-quality visuals.
Phase 3: Automation
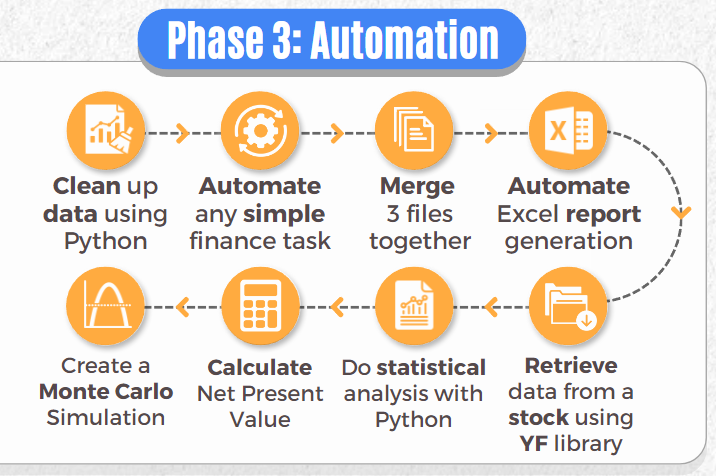
Automate month-end close tasks, create Monte Carlo simulations for project valuations, or generate daily KPI dashboards.
Use Python scripts triggered by a scheduler. Let the computer run your tasks at 2 a.m. while you sleep.
Phase 4: Forecasting
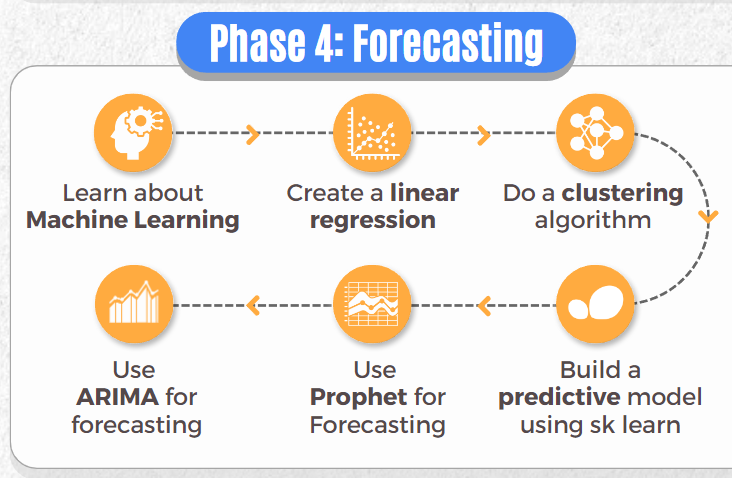
Explore ARIMA, Prophet, linear regression, or even machine learning models.
Generate a sales forecast model that updates and emails results to the finance team every week.
Start with a basic regression model, then use AI to experiment with more advanced approaches. Compare accuracies and refine.
Phase 5: Advanced Techniques

Integrate APIs, automate emails and slide deck creation, and incorporate advanced statistical models. If you produce a monthly board meeting deck, Python can compile the updated charts, and AI can draft commentary in PowerPoint. You review and refine, saving hours.
Why Are The Python Libraries Important for Finance?

One of Python’s greatest advantages is its vast ecosystem of libraries that are designed for specialized tasks.
Some of the key libraries that finance professionals can leverage within Excel include:
pandas
The most popular Python library for data manipulation and analysis. With pandas, you can quickly analyze, clean, and structure data into formats that are ideal for financial modeling.
NumPy
Perfect for handling large datasets and performing mathematical operations, including linear algebra and statistical calculations.
matplotlib and seaborn
These libraries allow you to create a wide variety of visualizations, from simple bar charts to more complex financial graphs and charts.
scikit-learn
A machine learning library that can help finance professionals build predictive models to forecast trends or make data-driven decisions.
Faker
Useful for generating synthetic datasets that can be used for testing financial models or training machine learning algorithms.
statsmodels
A library that allows for advanced statistical modeling, perfect for regression analysis and time-series forecasting in finance.
Building a Simple Python App Using AI
Creating full-fledged applications may sound like a developer’s job. But with AI tools, you can transform a Python script into a user-friendly tool your team can use—no coding knowledge required.
Example Scenario: Monthly headcount reporting across multiple countries is inconsistent. You need a single harmonized report.
Here’s how to do it step-by-step:
#1: Set Context with AI
Prompt your chosen AI model with: “I have multiple country-level Excel files with slightly different columns. I need a Python script that standardizes the columns, cleans the data, and merges them into one Excel workbook with separate tabs per country. Can you help?”
#2: Refine Logic
After the AI provides the initial code, say: “This looks good, but I also need to ensure that if ‘Full Name’ is missing, we combine ‘First Name’ and ‘Last Name.’ If ‘Annual Salary’ is missing, calculate it from ‘Salary’ * 12. Please add these rules.”
#3: Test and Tweak
Run the code in Visual Studio Code. If there’s an error, copy and paste it back into AI: “I got this error, how do I fix it?” You’ll quickly resolve issues.
#4: Add A GUI (Graphical User Interface)
Once the script works, prompt AI: “Create a simple GUI that lets a user select a folder of files and outputs a consolidated Excel file. Include instructions and a success message.”
AI will produce code using libraries like tkinter in Python.
#5: Package into an App
Use Python tools like pyinstaller to convert the script into an executable file. Now, colleagues can run the app on their laptops without having Python installed.
Result: A user-friendly tool that automates hours of monthly data prep. Next time you or your colleagues need that consolidated report, just double-click, select the folder, and let Python and AI do the heavy lifting.
From Manual Work to Strategic Insight with Python and AI
Integrating Python and AI into your financial workflows isn’t about adding unnecessary complexity—it’s about liberating you from low-value, time-consuming tasks.
By automating data cleaning, report generation, forecasting, and more, you reclaim the hours you once lost to manual processes.
In turn, you can redirect that energy toward strategic planning, insightful analysis, and forward-looking decision-making that truly shapes the future of your organization.
Adopting these tools may feel like a significant change, but the payoff is enormous.
With each step, from basic scripting to advanced custom applications, you’re redefining what’s possible in modern finance.
Instead of reacting to problems at month-end, you can proactively guide corporate strategy.
This journey enables you to deliver more timely, accurate insights while fostering a dynamic finance culture that is ready to meet tomorrow’s challenges.
FAQ
Q: Do I need coding experience to start using Python and AI in finance?
A: You don’t need a formal programming background. Modern AI tools can write initial drafts of your code, explain errors, and help you understand the logic. You can learn incrementally, starting with small tasks and letting the AI assist you at every step.
Q: How can I ensure data confidentiality when using AI and Python?
A: Most enterprises run AI models in secure, private environments. You can also anonymize sensitive data or rely on internal servers. Always follow your company’s data protection policies and consider solutions that allow AI-powered coding within a firewall-protected infrastructure.
Q: When will I start seeing results?
A: You can see immediate benefits even from small automation efforts. For example, automating the consolidation of monthly reports saves time right away. Over the following weeks and months, as you integrate more advanced capabilities—like forecasting models or scenario testing tools—the return on your investment grows exponentially.
Q: Which AI tools should I experiment with first?
A: Start with user-friendly and well-known platforms like ChatGPT or Microsoft Copilot. These tools integrate smoothly with common development environments, making it simpler to get started. Test a few options, see which aligns best with your workflows, and invest time in mastering that tool.
Q: How do I handle errors that pop up in the code?
A: Errors are part of the learning process. Copy the error message and ask your AI assistant how to fix it. Often, the solution is simple. Over time, you’ll become more comfortable interpreting errors and resolving them efficiently. The interplay between your growing skills and the AI’s assistance will gradually strengthen your coding expertise.


