We all know the drill of finance work: endless spreadsheets, repetitive data entries, and the constant pressure to meet deadlines.
As a finance professional, you’re no stranger to the headaches that come with managing complex data and tackling routine tasks that seem to never end.
It can feel like there’s no time left for the work that matters, like providing strategic insights and making a real impact.
But what if those draining and time-consuming tasks could be approached and done differently?
What if you could focus on the bigger picture and finally have the time to drive meaningful change?
Learn how you can automate your finance tasks using Python and Generative AI.
Table of Contents
10 Finance Tasks You Can Automate with Python

Finance teams deal with massive datasets, recurring processes, and intricate analyses.
While Excel has been the go-to tool for decades, Python is rapidly gaining ground as a more efficient and scalable solution.
Here are 10 finance tasks you can automate with Python:
#1: Automating Forecasting and Time Series Analysis
Forecasting is crucial in corporate finance, whether predicting future revenues, costs, or cash flow.
Excel’s built-in forecasting functions can handle basic needs, but as models get more complex, Excel struggles with scalability and accuracy.
Why Python is better?
Python simplifies forecasting by integrating historical data, adjusting for seasonality, and automating updates as new data comes in.
Once the model is set up, Python recalculates forecasts in real time, making it far more flexible and powerful than Excel.
Example
A company looking to forecast future cash flows based on historical sales data can automate the process with Python.
The ability to adjust for seasonal trends or unpredictable changes makes Python especially useful for real-time business decision-making.

#2: Efficient Data Cleaning for Accurate Analysis
Finance teams spend considerable time cleaning raw data. Whether it’s dealing with missing values, standardizing formats, or removing duplicates, data preparation is crucial for reliable analysis.
Why Python is better?
Python allows you to automate data cleaning through pre-defined rules. You can standardize data formats, remove inconsistencies, and handle large datasets seamlessly.
This is especially helpful when dealing with transactions across multiple systems or departments.
Example
A finance team preparing transaction data from multiple sources can automate cleaning tasks—like ensuring consistent date formats or eliminating duplicate entries—before conducting analysis.
In Excel, this would involve manual work, whereas Python standardizes and accelerates the process.
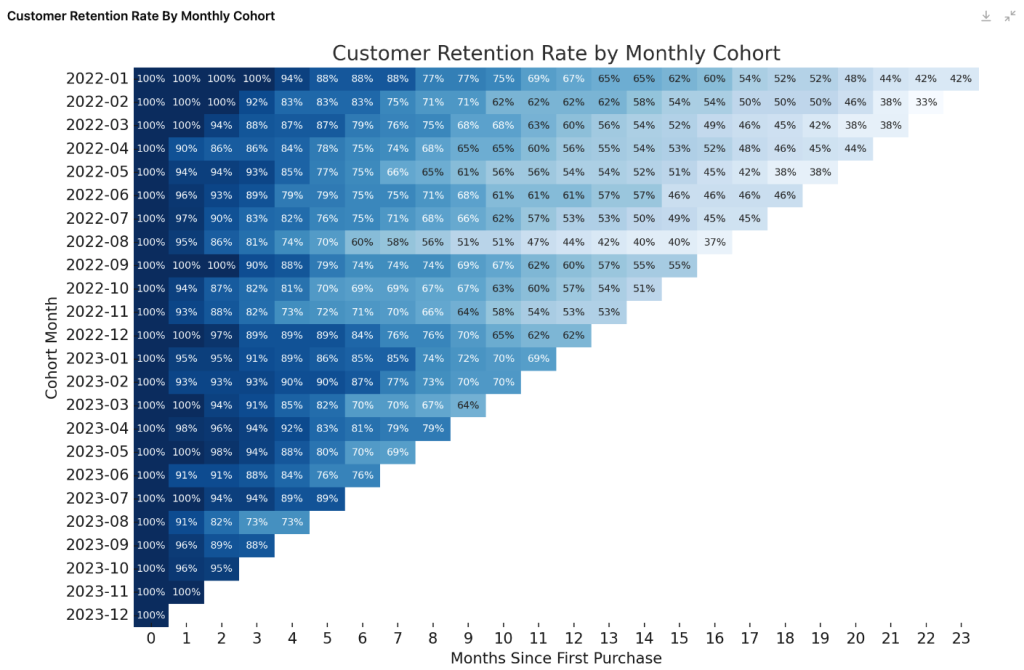
#3: Creating Complex Visualizations like Cohort Analysis
Cohort analysis and other advanced visualizations, such as waterfall charts, provide deeper insights into financial performance but are difficult to set up manually in Excel.
Why Python is better?
Python streamlines the creation of complex graphs by automating both data preparation and visualization steps.
Once the data structure is set, generating these visuals becomes a dynamic and repeatable process.
Unlike Excel, where you need to manually format and update charts, Python handles this automatically.
Example
Imagine tracking customer revenue retention over time using cohort analysis.
With Python, this involves creating the cohorts once, then generating the visualizations effortlessly, allowing finance teams to focus on interpreting results rather than building charts.

#4: Combining Files for Unified Reporting
In corporate finance, consolidating files—such as monthly reports or transactional data from various departments – is a recurring task.
Excel requires manually opening, copying, and pasting from multiple sources, which can become tedious and error-prone as data grows.
Why Python is better?
Python automates the entire process, enabling you to read multiple files, identify common fields, and merge them into a single dataset with ease.
Python efficiently handles large volumes of data from various formats (Excel, CSV, JSON), freeing you from repetitive work.
Example
Consider merging monthly sales data from multiple regional branches into a company-wide report.
With Python, you can automate this consolidation, ensuring accuracy and saving significant time compared to manual methods in Excel.
#5: Dynamic Cash Flow Projections
Cash flow projections are vital for budgeting and financial planning. However, updating assumptions, incorporating new data, and handling different scenarios can quickly become complex in Excel.
Why Python is better?
Python automates cash flow projections by integrating various data inputs (e.g., sales forecasts and payment schedules) and dynamically updating projections as conditions change.
It handles multiple scenarios without the manual reworking that Excel requires.
Example
A company can automatically generate monthly cash flow projections that adjust in real time as new sales and expense data are received.
With Python, these projections can incorporate different assumptions, such as late payments or seasonal fluctuations, making it much more adaptable than Excel.

#6: Automating Bank Reconciliations
Bank reconciliations are essential but time-consuming for finance teams, as they involve matching transactions from bank statements with internal accounting records.
Why Python is better?
Python automates the reconciliation process by comparing transactions between different datasets, quickly identifying mismatches, and flagging potential issues.
This eliminates the need for manual checks, which are slow and error-prone in Excel.
Example
Reconciliations, which often take hours when done manually in Excel, can be streamlined using Python.
Daily bank transactions are automatically cross-checked with internal records, providing real-time reconciliation with minimal effort.
#7: Automating Scenario and Sensitivity Analysis
Scenario analysis helps finance teams evaluate how changes in variables like interest rates, costs, or sales affect outcomes.
Excel can handle basic sensitivity analysis, but running multiple scenarios becomes cumbersome.
Why Python is better?
Python enables you to simulate hundreds of scenarios automatically, providing quick insights into how changes in key financial variables impact the company’s bottom line.
This allows for real-time analysis and decision-making.
Example
Imagine assessing how a 2% increase in interest rates would affect your company’s debt servicing costs.
Instead of manually adjusting numbers and recalculating, Python runs the simulations in seconds, producing detailed outputs for multiple interest rate scenarios.

#8: Expense Categorization and Reconciliation
Categorizing and reconciling expenses across corporate accounts is a frequent task.
In Excel, finance teams typically use manual sorting and formulas like VLOOKUP, which can be slow and error-prone.
Why Python is better?
Python automates categorizing transactions by applying predefined business rules.
It can also reconcile discrepancies faster and more accurately than Excel, reducing manual labor and improving efficiency.
Example
A company managing thousands of corporate credit card transactions can automatically categorize expenses (e.g., travel, office supplies) and reconcile them against internal budgets.
This would take significant time in Excel but can be done in minutes with Python.
#9: Risk Modeling for Financial Planning
Risk modeling, including techniques like Monte Carlo simulations, helps finance teams assess the potential financial risks under various conditions.
Excel can manage some of these models, but it becomes inefficient when handling complex simulations.
Why Python is better?
Python automates running complex risk models and simulates potential outcomes based on multiple factors. It’s ideal for running large-scale simulations, which would be difficult to manage in Excel due to its limited processing power.
Example
A finance team might use Python to simulate the potential impact of fluctuating market conditions on a portfolio of investments.
This analysis, which could take hours to set up in Excel, can be performed quickly and repeatedly with Python.

#10: Automated Data Fetching and Integration
Finance teams often rely on external data sources like stock prices, currency rates, or economic indicators for analysis.
In Excel, pulling this data from external sources typically involves manual updates or using plugins.
Why Python is better?
Python automates data fetching from various APIs or databases, integrating real-time data directly into financial models.
It eliminates the need for manual updates and ensures your analysis is always based on the latest data.
Example
A company can automatically pull real-time stock prices or exchange rates and integrate them into its financial models.
While Excel requires manual data updates or external plugins, Python automates the entire process, keeping reports current without manual intervention.
Last Thoughts
While Excel is a powerful tool for basic finance tasks, Python excels (pun intended) in automating repetitive processes, handling large datasets, and executing complex analyses.
From merging files and cleaning data to forecasting and risk modeling, Python simplifies workflows, reduces errors, and saves time, which allows finance teams to focus on strategy rather than manual data manipulation.
Integrating Python into your corporate finance toolkit allows you to move beyond Excel’s limitations and unlock greater efficiency and scalability.
FAQ
Q: What makes Python better than Excel for automating finance tasks?
A: Python offers better scalability and flexibility compared to Excel, especially when handling large datasets or complex analyses. It automates repetitive processes, reduces errors, and updates in real-time. Python also integrates seamlessly with various data sources, allowing finance teams to focus on strategy instead of manual data manipulation.
Q: How does Python help with forecasting and time series analysis?
A: Python allows for advanced forecasting by integrating historical data, adjusting for seasonality, and automating updates as new data comes in. Unlike Excel, where manual updates are often required, Python can handle dynamic recalculations in real-time, making it ideal for accurate financial forecasting and decision-making.
3. Can Python handle data cleaning tasks more efficiently than Excel?
A: Yes, Python can automate the data-cleaning process using predefined rules. It can standardize formats, remove duplicates, and handle missing values efficiently, which is especially useful when dealing with large datasets from multiple sources. In Excel, this process is often manual and time-consuming.
4. How does Python improve financial visualizations like cohort analysis?
A: Python simplifies complex visualizations by automating both data preparation and visualization. Once the data structure is set, Python can generate dynamic and repeatable visuals like cohort analysis, waterfall charts, and more, whereas Excel requires more manual formatting and updates for such tasks.
5. What are the benefits of automating bank reconciliations with Python?
A: Python can automatically compare transactions between different datasets, identify mismatches, and flag potential issues. This process is much faster and more accurate than manually checking transactions in Excel, significantly reducing the time and effort required for bank reconciliations.


